- 2015 was certainly an eventful year in energy, with plummeting oil prices and a widely anticipated global climate conference in December. It's less clear that it was a turning point.
When I sifted through the major energy developments of 2015, I was surprised by the number of references I found to last year as a turning point, whether for the oil industry, the response to climate change, coal-fired electricity generation, or renewable energy. To this list I am tempted to add the decision to allow unrestricted exports of US crude oil for the first time in 40 years.
Major turning points are best identified with the passage of time. With so many legitimate candidates it might seem a bit deflating to note, as the chart below reflects, that the growth pattern for US energy supplies in 2015 looks a lot like the one for 2014. Despite low prices, oil and gas output posted solid gains, at least through October, while wind and solar power contributed modestly, when compared on an energy-equivalent basis.

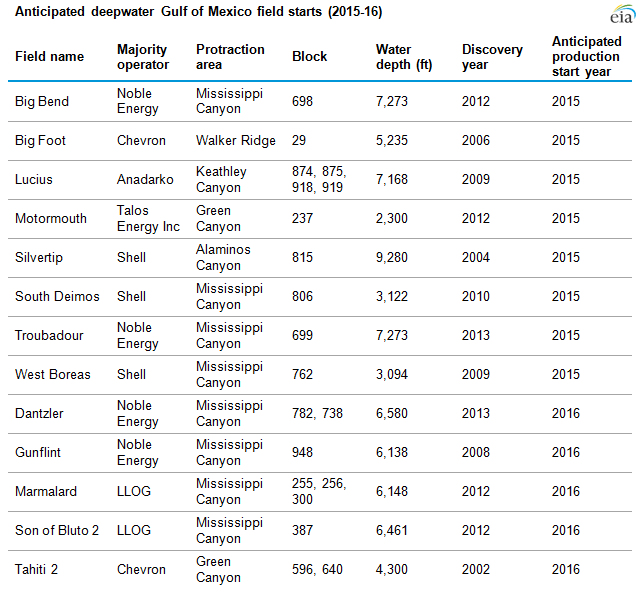
There are sound reasons to think that next year's graph may look quite different, starting with oil. The petroleum industry is still in turmoil from its turning point in late 2014, when OPEC declined to cut its output quota to restore the global oil market to balance. In North America and much of the world, drilling and investment in new projects are down sharply, and US oil production is retreating from the 44-year peak it reached in April. The subsequent decline would have been even more pronounced without the contribution of new deepwater platforms in the Gulf of Mexico that were planned long before oil prices fell.
Major turning points are best identified with the passage of time. With so many legitimate candidates it might seem a bit deflating to note, as the chart below reflects, that the growth pattern for US energy supplies in 2015 looks a lot like the one for 2014. Despite low prices, oil and gas output posted solid gains, at least through October, while wind and solar power contributed modestly, when compared on an energy-equivalent basis.

There are sound reasons to think that next year's graph may look quite different, starting with oil. The petroleum industry is still in turmoil from its turning point in late 2014, when OPEC declined to cut its output quota to restore the global oil market to balance. In North America and much of the world, drilling and investment in new projects are down sharply, and US oil production is retreating from the 44-year peak it reached in April. The subsequent decline would have been even more pronounced without the contribution of new deepwater platforms in the Gulf of Mexico that were planned long before oil prices fell.
However, anyone identifying 2015 as the start of a global shift away from oil, rather than another cyclical low point, must contend with some contrary statistics. Global oil demand appears to have increased by around 2%--equivalent to the output of Nigeria--in response to a 70% drop in oil prices. And despite a lot of media attention, electric vehicles--the leading contender to replace the internal-combustion cars that are the main users of refined oil--have yet to catch on with mainstream consumers.
Based on data from Hybridcars.com, US sales of battery-electric vehicles (EVs) grew slightly faster than the 6% pace of the entire US car market in 2015 but still accounted for less than 0.5% of all new cars. In fact, the combined US market share of hybrids, plug-in hybrids and battery EVs fell by 18%, compared to 2014, to below 3%. This is a respectable start for vehicle electrification, but it's not much different from the beachhead that hybrids alone occupied in 2009.
Although we might look back on this situation in a few years as a turning point, I believe that will depend on the condition of OPEC and the global oil industry, as well as the level of global oil consumption, when supply and demand come back into balance and today's high oil inventories are drawn down.
At the launch of API's latest State of American Energy report earlier this month I had the opportunity to ask Jack Gerard, the President and CEO of API, how he thought the current situation might change the oil and gas industry, and whether it would push it even farther towards shale development, including outside the US. His response focused on ensuring that policies will allow US producers to compete globally and build on the advantages of US resources, capital markets and rule of law to increase their share of the market.
As for US natural gas production, rising per-well productivity and growth in the Utica shale and Permian Basin offset less drilling in general and output declines in the Marcellus shale and elsewhere. The continued expansion of gas is remarkable, considering that natural gas futures prices (front month) averaged just $ 2.63 per million BTUs for the year and dipped below $2 in December. The LNG exports set to begin this month look very timely.
Renewable energy, mainly in the form of wind and solar power, continues to grow rapidly as its costs decline. US renewables got an unexpected boost in December when the US Congress extended the two main federal tax credits for wind, solar and other technologies, including retroactively reinstating the lapsed wind Production Tax Credit (PTC). Renewables should also benefit from the implementation of the EPA's Clean Power Plan, and from the effect of the Paris climate agreement on the investment climate for these technologies.
We may not know for years whether the Paris Agreement was truly a turning point for climate change, as many have suggested. Another prescriptive agreement with legally binding targets, along the lines of the Kyoto Protocol, was never in the cards. However, the Paris text is replete with tentative verbs, along the lines of, "requests, invites, recognizes, aims, takes note, encourages, welcomes, etc. " It remains up to the participating countries whether and how they fulfill their voluntary Intended Nationally Determined Contributions and financial commitments.
The Paris Agreement could turn out to be the necessary framework for firm steps by both developed and developing countries to reduce emissions and adapt to climatic changes that are already "baked in", or it might shortly be overtaken by other events, as previous climate change measures were in the aftermath of the 2008 financial crisis. The current financial problems of the world's largest emitter of greenhouse gases--arguably the most important signatory to the Paris Agreement--are not a positive signal.
With so many uncertainties in play, we should consider all of these potential turning points as signposts of changes that depend on other interconnected factors, if they are to lead to a future that breaks with the status quo. There are enough of them to make for a very interesting 2016, even if this wasn't also a US presidential election year.
A different version of this posting was previously published on the website of Pacific Energy Development Corporation.
