Showing posts with label WTI. Show all posts

Monday, August 31, 2015

What Do Futures Markets Tell Us About Long-term Oil Prices?

  • The tendency to believe that the prices of oil futures contracts are predicting the future price of oil is understandable but not supported by the track record of such bets.
  • The prices of long-dated oil futures merely reflect where buyers and sellers are willing to strike a deal today, for their own, diverse reasons.
A recent article in the Wall Street Journal reminded me of numerous debates about the significance of energy futures prices, when I was a trader and later a trading manager for the former Texaco, Inc.  Do changes in futures contract prices actually predict future oil prices as the Journal's reporter suggests? If so, then it might be reasonable to conclude that today's low oil prices could persist for years. However, from my perspective that over-interprets the market data and ignores some important oil fundamentals.

As tempting as it might be to think so, the futures market for West Texas Intermediate (WTI) crude oil isn't a crystal ball, and neither is the market for UK Brent crude. A futures price is simply the price someone is willing to pay or receive now for oil to be delivered (or settled without delivery) later. It is typically based on business needs, rather than deep analysis.  A concrete example might be helpful.

The parties who on August 11th bought or sold oil for $56 or $57 in December 2017 likely did so, not because they were certain what the price would be then, but because they couldn't be sure and either needed to hedge another transaction or activity, or thought it constituted a reasonable bet. Aggregating a modest number of such transactions--long-dated futures trade much less frequently than those for the near months--doesn't improve the accuracy of these bets on an inherently unpredictable commodity over long intervals. Anyone who thinks it does should examine the track record of oil futures as predictions; it is a sobering exercise, especially for those who have traded this market.

Consider that while the September 2015 WTI contract closed at a little over $43 per barrel that afternoon, traders were buying and selling the same contract for more than twice as much during long stretches of 2012--about as far removed from us as the late-2017 contract prices cited in the Journal article as evidence of a persistent oil-price slump. Prices for the September 2015 contract were even higher in the middle of last year, when traders knew nearly as much about the growth of US tight oil production and its rising productivity as we do today, but crucially didn't know that OPEC would choose not to cut output to alleviate an over-supplied market as they had done in the early 1980s and late 1990s. Similar examples abound.

So how else might one explain the fact that long-dated oil contracts are trading for less today than they were this spring, if not as a prediction of a longer period of low prices ahead? Behavior and learning play key roles. With the  first anniversary of this historic price collapse just a few months off, expectations of a quick rebound in prices have faded. The possibility that the US could produce as much tight oil, for now, with fewer than half as many drilling rigs in operation as a year ago has sunk in. So has the reality that as painful as $50 oil is for some of OPEC's members, cartel leaders like Saudi Arabia show little inclination to blink first.

However, others are blinking, and that's why I'm skeptical that oil prices can remain this low indefinitely. The cuts in staff and investment budgets by major oil companies and their national oil company peers have been breathtaking, totaling $180 billion this year according to one analysis. The cuts suggest that the projects in question require significantly higher oil prices to be profitable, even after recent cost reductions, or have become too risky at current prices.

Few of these companies are big players in shale. Their bread and butter is large, conventional onshore oil fields and enormously expensive deepwater oil projects, the collective output of which is inherently subject to annual declines in output. Decline is the "silent killer" of output, to the tune of 5% or so every year. The only way to offset this trend within the portfolios of these producers is to spend large sums every year on new wells and new projects--projects that according to Rystad Energy, as cited by Bloomberg, have been cut more than at any time since 1986.

We must also put the US shale revolution in its proper context. When added to a global market that was balanced between supply and demand at around $100 per barrel, it was a game-changer, not least because no other producer or group of producers was willing to reduce output enough to accommodate this new source. However, even at today's 5.4 million barrels per day US tight oil represents only about 6% of global supply. The combination of shale plus OPEC covers less than half the world's oil demand.

The remainder must come from onshore and offshore oil fields in non-OPEC countries like Brazil, Canada, Mexico, Norway, and Russia. This non-OPEC supply has grown thanks to  a wave of completions of  large projects begun 5-10 years ago, when prices were rising rapidly. However, reduced investment now surely means lower non-OPEC production within a year or two.

The key question for future oil prices is therefore when demand, which according to the International Energy Agency is growing rapidly under low prices, and supply, for which new investment has suddenly shifted from the accelerator to the brake pedal, will cross over, erasing today's glut. It's hard to infer the answer from the thinly traded market for long-dated oil futures contracts.

Wednesday, October 15, 2014

The Impact of the Global "Sweet" Crude Bulge

  • The recent slide in global oil prices has been compounded by the pressure that rising US shale oil production is putting on the price of sweet crude benchmarks like Brent.
  • OPEC's producers may suffer as much as those in the US, while consumers benefit from significantly lower fuel prices than last year.
When the US went to war in Iraq in 2003, the price of oil embarked on a trend that took it from around $30 per barrel to nearly $150 before collapsing in the recession in 2008. This time, as a new US-led coalition takes on ISIS with a bombing campaign in Iraq and Syria, the price of oil is falling, down 20% in the last two months. It's not just that global economic growth has weakened recently, or that soaring shale oil output in the US has averted another oil crisis. Oil's current downturn also reflects the fact that new production from the Bakken, Eagle Ford and other shale deposits is particularly well-suited to undermine oil's global benchmark prices, for Brent and West Texas Intermediate, both of which are made up of light sweet crude oil streams.

The numbers for US shale, or "light tight oil" (LTO) as it's often called, are impressive, especially to those accustomed to watching the gradual ebb and flow of different oil sources over long periods. In the 12 months ending in June 2014, US oil production grew by 1.3 million barrels per day (MBD), not far short of Libya's pre-revolution exports. Since January 2011, the US added 3 MBD, or about what the UK produced at its peak in 1999. In fact, since 2010 incremental US LTO production has exceeded the net decline of the entire North Sea (Denmark, Norway and UK) by around 2 MBD, contributing to a significant expansion of Atlantic Basin light sweet crude supply.

The New York Mercantile Exchange defines light sweet crude as having sulfur content below 0.42% and an API gravity between 37 and 42 degrees. That's less dense than light olive oil. The specification for Brent is similar. Much of the LTO produced from US shale formations fits those specifications, and what doesn't is typically even lighter and lower in sulfur.

The current "contango" in Brent pricing, in which contracts for later delivery sell for more than those for delivery in the next month or two, is another sign of a market that is physically over-supplied: more oil than refineries want to process, with the excess going into storage. However we also see indications that the historical premium assigned to lighter, sweeter crude versus heavier, higher-sulfur crude is under pressure.

One example of this is the gap or "differential" between Louisiana Light Sweet, which wasn't caught up in the delivery problems that plagued West Texas Intermediate for the last several years, and Mars blend, a sour crude mix from platforms in the Gulf of Mexico. From 2007-13 LLS averaged around $4.50 per barrel higher than Mars, while for the first half of this year it was only $2.75 higher and today stands at around $3.40 over Mars.

And while OPEC's reported Reference Basket price has been falling in tandem with Brent, its discount to Brent had also narrowed by about $1 per barrel, prior to the price plunge of the last couple of weeks, compared with the average for 2007-13. Considering that OPEC's basket includes light sweet crudes from Algeria, Libya and Nigeria that sell into some of the same Atlantic Basin markets as Brent, that looks significant.

By itself a narrowing of the sweet/sour "spread" of only a dollar or so per barrel isn't earth-shattering. However, because the surge of US oil production is effectively focused on the oil market segment represented by the price of Brent, it compounds the pressure on OPEC, many of whose members link the price of their output to Brent. This might help explain why the response of OPEC's leading producer, Saudi Arabia, has been to cut prices rather than output, in an apparent effort to maintain market share rather than price level.

The Saudis know better than anyone how that movie could end. The Kingdom's1986 decision to implement "netback pricing", linking the price of its oil to the value of its customers' refined petroleum products, helped precipitate a price collapse so deep that it took oil prices 18 years to reach $30/bbl again, by which time the dollar had lost a third of its value.

Whether aimed at US shale producers or as a reminder to the rest of OPEC, which appears to be unprepared to make the output cuts necessary to defend higher oil prices, the Saudi action increases the chances that oil prices will over-correct to the downside, rather than rebounding quickly. If so, the impact of the sweet crude bulge in the Atlantic Basin--only a little more than 3% of global oil supplies--could play a disproportionate role in prolonging the pain producers will experience until oil markets eventually reach a new equilibrium.

In the meantime, US consumers are benefiting from gasoline prices that are already $0.15 per gallon lower than this week last year. Today's wholesale gasoline futures price for November equates to an average retail price well below $3.00 per gallon, after factoring in fuel taxes and dealer margins, compared to last year's average retail price for November of $3.24. After factoring in lower diesel and heating oil prices, the fall in oil prices could put an extra $10 billion in shoppers' pockets for this year's holiday season.

A substantially different version of this post was previously published on the website of Pacific Energy Development Corporation

Friday, August 02, 2013

Oil's Eastern Hemisphere is Shifting, Too

  • OPEC's exports earned record revenue last year, but the pressure on the cartel is increasing as Eastern Hemisphere production expands, along with higher unconventional oil production in North America.
  • Increasing supply doesn't guarantee lower oil prices in the future, but it will help accommodate growing demand from the developing world, reducing the risk of price spikes such as we saw in 2008.
No one should be surprised that the turmoil in Egypt has caused jitters in the oil markets.  Although Egypt has recently become a net oil importer, the possibility of extended violence or even civil war poses risks to the tanker traffic through the Suez Canal. This has helped to push UK Brent crude to its highest level since April and contributed to higher prices for West Texas Intermediate (WTI) crude than we've seen in over a year.  Yet while these events provide the latest of many prods to nudge oil prices higher, underlying long-term supply trends look favorable.  That's not just because of surging US oil output, which is largely attributable to shale or "tight oil."

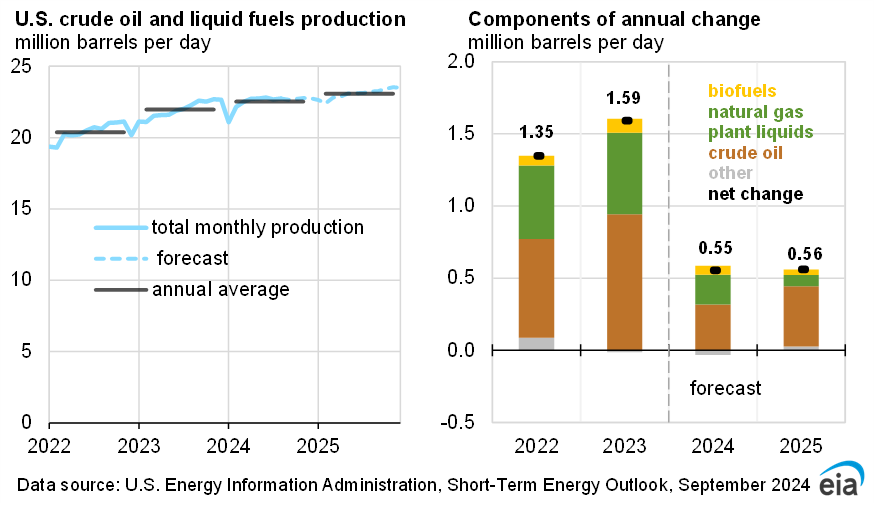
US production of crude oil and natural gas liquids grew by roughly 2 million barrels per day (MBD) from 2008-12, with a similar increase expected by 2020, even in the relatively conservative forecast of the US Energy Information Administration.  As a result, US oil imports are shrinking, scrambling long-established supply patterns in the Atlantic Basin. However, North America isn't the only place where supply is expanding, nor is the shale revolution responsible for the production growth in the Eastern Hemisphere, at least not yet.

The big story there is Iraq. Thanks to the development contracts its government negotiated with international firms after the fall of Saddam Hussein, Iraqi production is growing and might eventually reach the potential suggested by its enormous conventional oil reserves. Whether or not Iraq really has 150 billion barrels of oil in the ground-- this figure ratcheted up over the years in an odd two-step with its historical rival Iran--the consensus is that it has ample scope to boost output at relatively low cost. 

As the Financial Times reported, Iraq's plans to increase oil production capacity from around 3 MBD to 12 MBD, which would put it in the same league with Saudi Arabia, are now in doubt due to multiple concerns.  But even with companies seeking to renegotiate service contracts that looked too lean when they were set, and the Kurdistan Regional Government in the north of Iraq signing deals independently of Baghdad, Iraq produced more oil last year than it had since the outbreak of the Iran-Iraq War in 1980. The International Energy Agency apparently expects Iraqi production to nearly double to 6.1 MBD by the end of the decade.

If this comes to pass, it will significantly alter the dynamics within the Organization of Petroleum Exporting Countries, and possibly change OPEC's role in the market. It would lift Iraq well above other producers like Iran, Kuwait, the UAE, and Venezuela--all clustered around 2-3 MBD--and leave it second only to Saudi Arabia. Given recent Saudi domestic consumption trends, the race for future export leadership could be even tighter.

Despite record oil revenue last year, tensions are growing within OPEC, which had welcomed post-war Iraq back into its ranks and didn't constrain its output with an official production quota.  This accommodation is even simpler today, with OPEC operating without country-specific quotas. Yet in the absence of a large increase in demand for OPEC's oil in the developing world, a steadily expanding Iraq will either force painful adjustments on other members or bust the cartel's quota entirely.  Whether that results in rising inventories or merely higher spare production capacity, it would exert downward pressure on oil prices and on OPEC members' national budgets.

Another important shift is associated with the growth of oil output in Kazakhstan, the second-largest oil producer to emerge from the breakup of the Soviet Union.  Production has increased steadily since the 1990s, reaching 1.7 MBD last year. With the startup of the supergiant Kashagan field later this year, the country's production should exceed 3 MBD by 2020, with exports over 2 MBD. That would make Kazakhstan a bigger factor in global oil markets than Iran, as long as the latter continues to be hemmed in by sanctions. 

No one can predict oil prices in 2020 with any certainty. However, the combination of significant supply growth in North America, Iraq and the Former Soviet Union with flat or shrinking demand in the US and Europe provides headroom for further demand growth in Asia and the Middle East itself.  That doesn't necessarily augur a big drop in prices ahead--much of this new production isn't exactly cheap--but it could signal a period of greater price stability than we've experienced for a while.  That's assuming none of the various crisis scenarios erupts in the meantime.

A different version of this posting was previously published on the website of Pacific Energy Development Corporation.

Friday, June 07, 2013

Could US Oil Trends Alter How Oil Prices Are Set?

  • Oil prices weren't always set by a transparent global market. Current pricing mechanisms emerged from much less transparent precursors.
  • Resurgent US production, combined with restrictions on US oil exports, could disconnect the US from the global oil market, with unexpected results.
If you follow energy closely, you've likely lost count of the number of times you've heard an economist, executive or government official explain that oil prices are set by the global market, and not by oil companies or the US government.  Although somewhat over-simplified, this statement has been valid for roughly 30 years.  However, it hasn't always been the case. Current trends in US production, together with existing regulations, make me wonder if it will remain accurate in the future, as the US inches closer to what is commonly referred to as energy independence. 

The market-based system of oil prices, with its transparency and easy trading among regions, didn't appear overnight.  Until the early 1970s, Texas played a role similar to Saudi Arabia's current swing producer role within OPEC.  By limiting the output of the state's oil wells, the Texas Railroad Commission effectively determined the global price of oil--to the extent there was one--until Texas had no spare capacity left.  That set the stage for OPEC, a succession of oil crises, and the US oil price controls that were imposed in the 1970s in an attempt to help manage inflation. There was also no single, representative oil price.  Instead, prices were set by producers' contract terms and the discounts large refiners could negotiate, or by federal regulations.  The current system emerged from a series of developments in the 1980s.

When US oil price controls ended in 1981, oil futures trading was just getting underway on the New York Mercantile Exchange.  The heating oil contract was launched in 1980, followed by the West Texas Intermediate (WTI) crude oil contract in 1983. This combined large-scale oil trading with an unprecedented level of transparency.   It was also significant that the US, the world's biggest oil consumer, had become a major oil importer after domestic production peaked in 1970.  Because refineries on the coasts competed for oil supplies with refiners on other continents, the price of WTI couldn't get too far out of line with imported crudes without creating arbitrage opportunities for traders.  And any part of the US connected by pipeline to the Gulf Coast was effectively linked to oil prices in Europe, the Middle East and Asia.

After OPEC miscalculated the response to the very high prices its members were demanding in that period--reaching $100 per barrel in today's dollars--global oil demand shrank by nearly 10% from 1979 to 1983, while non-OPEC production grew by more than 12%.  Prices soon collapsed, and OPEC's dominance of oil markets faded for most of the next two decades, during which the futures exchanges and trading relationships of the modern oil market took hold. 

What could shake the current system of oil prices?  It has already withstood recessions, wars in the Middle East, the collapse of the Soviet Union, and the explosive growth of Asia, with China alone adding oil demand comparable to that of the EU's five largest economies.  However, since the current system is based on the free flow of oil between regions, anything that impedes that flow could undermine the way oil is currently priced.

Setting aside conflict scenarios, consider the potential impact of sustained growth in US production, combined with flat or declining demand and no change in the current prohibition on most US crude oil exports.  The gyrating differential between WTI and UK Brent crude, reflecting rising production in the mid-continent and serious logistical bottlenecks, provides a glimpse of what this could be like.  With much of the new US production coming in the form of oils lighter than those for which most Gulf Coast refineries have been optimized, keeping rising US crude output bottled up here could result in US crude prices diverging even farther  from global prices, while forcing US refineries to operate less efficiently and import and export more refined products.  With oil imports drastically reduced and oil exports still banned, US oil prices might be influenced more by the global market for refined products, with its different dynamics and players, than by the global crude oil market .

In some respects, that sounds a lot like what many politicians and "energy hawks" have been seeking for years: a US no longer subject to foreign oil producers' price demands.  Yet this same scenario could yield all sorts of unintended consequences, including a less competitive US refining industry and higher or at least more volatile prices for gasoline, diesel and jet fuel.  And just as we've seen with cheap natural gas, cheaper oil could undermine the economics of the unconventional oil and gas production that makes it possible in the first place. 

US oil export policy merits a thorough reevaluation, and soon, because the regional impacts of a continued no-export stance could become pronounced, even if the US never reached overall oil self-sufficiency. Such a review should include related regulations, such as the Jones Act restrictions on shipping. With crude oil exports to Canada -- virtually the only allowed export destination for our newly abundant crude types--already rising rapidly, some Canadian refineries may be positioned to supply US east coast fuel markets more cheaply than refineries in New Jersey.  That certainly qualifies as an unintended consequence.

A slightly different version of this posting was previously published on the website of Pacific Energy Development Corporation.

Wednesday, April 17, 2013

How Will Oil's Current Slide Affect Gasoline Prices?

  • How far could crude oil prices fall, and what does it mean for US pump prices this summer?
  • The broad trends behind oil's current weakness could persist for some time. 

We all carry assumptions around with us.  For many who follow energy one such assumption is that oil prices, and thus gasoline prices, generally rise over time.  In an otherwise fairly well-reasoned blog post I read yesterday, that logic underpinned the case for electric vehicles (EVs) becoming more attractive to consumers.  Yet if we review the history of oil prices, it becomes clear that they don't only rise.  Just recently, the price of Brent crude oil, the current world benchmark, has declined roughly 11% since the start of April, prompting speculation about where it's headed from here and what that might mean for motorists.  It's worth stepping back from the day-to-day volatility of the market to consider what's behind this drop, as well as how OPEC might respond if the recent trend continues.

Start with the fundamentals of demand and supply.  Demand in the developed world remains weak. Despite modest GDP growth in 2012, US oil demand fell by 2% last year and is now 11% below its 2005 high.  This year, the unemployment rate is down a bit, but economists see signs of another  "spring swoon." The outlook seems no better in the other big economies, including China, prompting the International Energy Agency last week to cut its estimate of annual oil demand growth to just below 800,000 barrels (bbl) per day, with the US government cutting its estimate even further.  Meanwhile, many refineries are either undergoing maintenance or about to, reducing the most direct element of demand, at least temporarily. 

On the supply side, US production growth remains the big story.  US crude oil output is currently 7 million bbl/day, up nearly a million bbl/day in just the last year, and projected to average at least 300,000 bbl/day more than that for 2013. Overall, the IEA anticipates non-OPEC oil supply to increase by 1.1 million bbl/day this year.  Whenever non-OPEC growth exceeds the growth of demand, while inventories and spare production capacity are adequate, that puts pressure on OPEC and oil prices tend to weaken.  North Korea, Iran and a few other hot spots provide ample geopolitical risk, but the market has already absorbed the loss of about half of Iran's exports due to sanctions, while some other problem areas, such as Sudan/South Sudan, are being resolved. 

Taking all this into account, the market seems to have concluded prices were too high.  This is the other face of speculation that is never subjected to Congressional investigations.  Yet it also seems premature to assume this is the start of a major move downward, or an imminent oil price collapse.  Nick Butler of the Financial Times suggested that normal economics would take us to around $70/bbl, though I think he underestimates OPEC's cohesion and their willingness to absorb pain to defend a crucial price threshold.  Their experience in 2008-9 provides a vivid recent reminder that selling 10% less oil at something close to the current price is a much better deal for them than selling all the oil they can at $35/bbl.

It's also not clear how quickly a sharp drop in prices would undermine the output of the Bakken, Eagle Ford and other big US shale oil plays. These reservoirs require more intensive drilling than conventional oil fields, and many of the drilling rigs in use there were redeployed from gas-rich opportunities after the US price of natural gas slid sharply in the last several years.  It also seems that some of the weakness in Brent is specific to its market. West Texas Intermediate (WTI) crude hasn't dropped as quickly, thus narrowing the gap between the two from $20/bbl as recently as February to about $11 today.  So those parts of the US where refiners still import significant quantities of foreign crude pegged to Brent, such as the east coast, might see more gasoline price relief than those where abundant supplies of cheaper, WTI-related crude have kept pump prices lower.

And that's what it boils down to for most Americans, who don't burn crude oil or invest in oil futures.  The Energy Information Administration (EIA) of the US Department of Energy recently issued its Summer Fuels Outlook, projecting that US gasoline prices would average $3.63 per gallon for the April-September "driving season", down from $3.69 last year and up just slightly from last week's $3.61/gal. However, that forecast was based on a July Brent crude price of $107/bbl.  Crude oil makes up around two-thirds of the retail cost of a gallon of gasoline in the US, where fuel taxes are relatively low compared to other developed economies. If Brent merely held where it is today we could see summer gasoline prices below $3.50/gal. for the first time in several years.

Longer-term, oil and gasoline prices remain as unpredictable as ever.  However, the trends combining to produce today's weaker prices could well have staying power.  It's still relatively early days in the US shale, or "tight oil" upsurge, with more growth expected, and new-car fuel economy continues to improve.  Those factors support the trend of falling US oil imports, which will take pressure off global markets, no matter what happens to demand in Asia.  At least until we see a different configuration of factors the argument for suspending our assumption of steadily rising future oil and motor fuel prices looks pretty robust.  That suggests that the case for EVs and alternative fuels must be made on the basis of other factors and, if anything, be prepared to weather another period of lower fuel prices should oil continue to weaken.

Wednesday, June 13, 2012

The Summer Oil Slump

Instead of US consumers facing $5 gasoline this summer, as some analysts had predicted, we now find prices slipping well below $4 per gallon as oil prices respond to weakening demand, a stronger dollar, and steady supply growth.  Yet as welcome as this is, it's largely the result of a mountain of bad news: Not only does financial turmoil threaten the very existence of the European Monetary Union and its currency, the Euro, but economic growth in the large emerging economies is also slowing, at least partly in response to the weakness in the developed countries that constitute their primary export markets.  The engine of global growth for the next year or two just isn't obvious.  That's the backdrop for this week's OPEC meeting in Vienna.

Before we become too enthusiastic about the prospect of a period of cheaper oil, we should first put "cheap" in context.  Even ignoring West Texas Intermediate (WTI), the doldrums of which I've discussed at length, the world's most representative current crude oil price, for UK Brent, has fallen consistently below $100 per barrel for the first time since the beginning of the Arab Spring in 2011.  Yet even if it fell another $10/bbl, to about where WTI is currently trading, it would still exceed its annual average for every year save 2008 and 2011.  So while oil might be less of a drag on the economy at $90/bbl than at $120, that's still short of the kind of drop that would be necessary for it to provide a substantial positive stimulus, particularly when much of the drop reflects buyers around the world tightening their belts. 

The US is in a somewhat better position, thanks to surging production of "tight oil" in North Dakota and onshore Texas. This has more than made up for the inevitable slide in output from the deepwater Gulf of Mexico, two years after Deepwater Horizon and the ensuing drilling moratorium. With much of the new production trapped on the wrong side of some temporary pipeline bottlenecks, parts of the country are benefiting from oil prices that are $10-15/bbl below world prices, although short-term gains are a poor reason to perpetuate those bottlenecks, rather than resolving them and allowing North American production to reach its full potential.

Then there's the issue of speculation, which some politicians blamed for the recent spike in oil prices.  To whatever extent that was true--and I remain skeptical that the impact was nearly as large as claimed--we could be about to see what happens when the dominant direction of speculation flips from "long" to "short"--bullish to bearish--as noted in today's Wall St. Journal.  Since the main effect of speculation is to increase volatility, we could see oil prices temporarily drop even further than today's weak fundamentals would suggest they should.

All of this will be on the minds of the OPEC ministers meeting in Vienna Thursday, along with the usual dynamics between OPEC's price doves and hawks.  The pressures on the latter have intensified as Iran copes with tighter sanctions on its exports and Venezuela's ailing caudillo faces a serious election challenge.  OPEC meetings are rarely as dramatic as last June's session, but the global context ensures a keenly interested audience for this one.  Given the impact of gas prices on US voters, both presidential campaigns should be watching events in Vienna as closely as any traders.  $3.00 per gallon by November isn't beyond the realm of possibility.  It would only require a sustained dip below $80/bbl.

Thursday, February 09, 2012

Why Are Gasoline Prices So High in February?

US gasoline prices are setting records for this time of the year, with the current price apparently the highest ever for February, at least in nominal dollars. In fact, the monthly average US retail price for unleaded regular has set new records every month since last October. That isn't quite as dramatic as it might seem, because based on the Department of Energy's data, the previous records for those months were set just a year earlier. Yet it's still a significant drag on the economy--an anti-stimulus, as I've noted previously. Unfortunately, some of the explanations I've seen for these price levels, including the ones offered in last night's CBS Evening News, focus too much on minor factors such as refinery maintenance and commodity speculation, while ignoring the most basic influence: the price of oil. That's understandable if they're watching the wrong oil price.

If you've been reading this blog for a while, you know why the most-watched oil price in America, the one for West Texas Intermediate crude (WTI), is no longer representative of the broader US oil market, at least for now. The best domestic grade to follow at the moment is probably Louisiana Light Sweet (LLS), which is of similar quality to WTI but not subject to the persistent transportation bottleneck at Cushing, OK. It tracks closely to UK Brent crude, which has largely taken over the role of global oil price indicator. The "spot" price of LLS was $119 per barrel today, accounting for 94% of the price of prompt gasoline futures on the New York Mercantile Exchange (NYMEX) today. And the $16/bbl increase in LLS since February 9, 2011 explains nearly 80% of the increase in the wholesale gasoline price over that interval. So while refinery outages might be having some impact, particularly in the local and regional markets served by the affected facilities, they are not the main show, nor is speculation in gasoline futures, the effect of which beyond the New York area covered by the NYMEX contract should be rather attenuated.

So with gas prices this high, this early in the year, how high might they be when the summer driving season arrives? That also comes down to crude oil, prompting questions about why oil prices are so high today, despite relatively weak demand. Many analysts attribute oil's strength to worries about Iran's threat to close the Strait of Hormuz as the sanctions noose tightens, along with rumors that Israel may be preparing to strike Iran's nuclear sites on its own this spring. But as with any such risks, they will either manifest or they won't, and the more time that goes by without these feared events occurring, the less influence they are likely to have in propping up oil markets, absent a surge in underlying demand due to a strengthening global economy. If none of that takes place, then oil prices could ease, resulting in summer gas prices not much worse than what we see today. However, I'd be wary of reversing that logic: Keeping gas prices low is not a sufficient reason to back away from addressing the risks posed by what the International Atomic Energy Agency refers to as the "military dimensions" of Iran's nuclear program.

Monday, December 26, 2011

2011 in Energy: The Year of...

At the start of 2011, I thought the hallmark of the year's energy events and trends might involve regulation, with the White House seeking to implement measures that couldn't garner enough support in Congress to become laws. But for every major new regulation issued, such as last week's release of the new Mercury and Air Toxics Standards for power plants, others were delayed or deferred, including the EPA's effort to regulate greenhouse gases under the Clean Air Act and the agency's proposed ozone standard. Outside of the utilities and other industry groups directly affected by these rules, it seems likely that 2011 will instead be remembered for big, unpredictable events like the Fukushima nuclear accident and the Solyndra bankruptcy scandal, along with several major trends that reached critical mass this year. Anyone attempting to pick the energy story of the year is spoiled for choice.

In my search for a catchy title for this year's final posting, I toyed with "The Year of Solyndra", "The Year of Shale", "The Year of Fukushima", "The Year of Exports", and various other combinations of the energy buzzwords that percolated into our consciousness this year. In some ways, they'd all be apt choices. Here's a quick rundown on why they might merit that kind of recognition, with links to previous postings providing more details on each:
  • If 2011 is the year of Solyndra, it's not because of the possibility that the government's $535 million loan to the firm was the result of political influence (cue Major Renault), or even that the Department of Energy is unlikely to recover more than pennies on the dollar in the firm's bankruptcy. Instead, it's because Solyndra highlighted the much broader and deeper problems of a global solar industry that, despite continued demand growth that other industries would kill for, now faces overcapacity and the fallout from the winding down of unsustainable government support. Germany's Solar Millennium is just the latest victim of this trend. Along with BP's exit from the solar business after 40 years, it provides a further reminder that renewable energy firms must succeed not just as technology providers, but as businesses that can earn consistent profits and continue to attract investors.


  • Shale gas was hardly new to the scene in 2011; it has been expanding rapidly for several years and now accounts for up to a third of US natural gas production. However, the controversy surrounding drilling techniques like hydraulic fracturing that make its exploitation possible became much more widespread this year, while some scientists raised questions about its contribution to greenhouse gas emissions. Shale gas has the potential to transform nearly every aspect of our energy economy, and probably sooner than renewable energy sources could. That has some folks nervous, while others are eager for shale gas to displace coal from electricity generation, compete with oil in transportation, and revive the domestic petrochemical industry. I suspect we'll see all of those to some extent, provided we don't regulate shale out of the running.


  • The aftermath of Fukushima could prove equally transformational, though it remains to be seen whether the ultimate result is safer nuclear power or a global retreat from one of our largest sources of low-emission energy. All but 8 of Japan's 54 nuclear power plants are currently idle, and that nation must shortly decide whether it will eventually restart those units that weren't critically damaged, or shut down the rest and attempt to run its manufacturing-intense economy on a combination of renewables and much larger imports of fossil fuels. The German government's post-Fukushima decision to phase out nuclear energy entirely could provide an even quicker test of the same proposition.


  • Another major shift that has been in the news recently involves exports. Although the US has long exported coal and various petroleum products, we could shortly become a bigger, more consistent exporter of many fuels, including liquefied natural gas (LNG), gasoline and diesel. As the reaction in a CBS news segment last week demonstrated, the US public doesn't know quite what to make of this, yet. Becoming a major energy exporter while still importing a net 9 million barrels per day of crude oil is very different than the picture of isolated self-sufficiency that four decades of "energy independence"rhetoric has evoked. We shouldn't be surprised that energy can provide a boost, and not just a drain on our trade balance. This topic requires more public discussion and education, before we see serious proposals to ban such exports--proposals that would make no more sense than banning exports of corn, tractors, or aircraft in an attempt to keep their US prices low.


  • It's also tempting to call this the Year of Oil Price Confusion. The news media gradually woke up to the huge gap that had developed between global oil prices and the oil price that Americans tend to watch most closely, the one for West Texas Intermediate crude. Yet despite numerous stories on the storage and pipeline crunch and supply glut at Cushing, Oklahoma, few reporters and networks seemed able to follow through by breaking their old habit of treating the NYMEX WTI price and its gyrations as if it were still the best indicator of the overall oil market. Fortunately, the problem is in the process of being resolved, as pipelines are reversed and more tankage built.


  • Finally, there was the administration's non-decision on the Keystone XL pipeline. Observers can read much into this, including the growing influence of citizen activists mobilized via social media. However, if it does nothing else, the Keystone controversy should put to rest the superficial fallacy that anything that improves greenhouse gas emissions is automatically good for energy security, instead of requiring difficult trade-offs. In that context, the prospect that the administration might ultimately turn down the permit for Keystone would be easier to stomach if the net greenhouse gas savings involved amounted to more than a paltry 0.3% of annual US emissions, based on the emissions from incremental oil sands production the pipeline might facilitate, compared to those from the conventional imported oil it would displace.

It was a busy year for energy, and if my short list of top stories missed something crucial, please let me know. 2012 promises to be just as interesting, with a Presidential election, in which energy issues could feature prominently, added to the mix. In the meantime, I'd like to wish my readers in the UK and Commonwealth a happy Boxing Day, and to all a Happy New Year.

Thursday, August 25, 2011

Why Haven't Gas Prices Fallen More?

With the US economy stuck in the doldrums, weakening the demand for oil and its products, and with the fall of at least portions of Tripoli foreshadowing the eventual return of Libyan oil exports to the market, it must seem puzzling that US gasoline prices haven't dropped farther in the last few weeks. As of Monday, the national average price for unleaded regular stood at $3.58 per gallon, only 3% lower than a month ago, when crude oil was just shy of $100 per barrel, compared to around $84 today. On Monday's evening news, CBS ran a segment attempting to explain this apparent disconnect. Unfortunately, they over-simplified the main explanation with a graphic showing cheaper domestic crude oil mixing with higher-priced imported oil. The "A" answer to this question is simpler but not well-understood, even though its elements have been fairly widely reported: Americans are simply looking at the wrong crude oil price, out of long habit. When you compare current gasoline prices and more representative crude oil prices, there isn't much of a disconnect about which to grumble.

The source of this confusion is the price of West Texas Intermediate crude oil (WTI), which for three decades has been the most watched and widely traded oil price in the world, and the basis of what most people mean when they talk about the price of "oil." In fact, there are numerous distinct grades of oil, each with its own price reflecting quality, location and availability. However, until recently most of these prices were based on the price of WTI, plus or minus a relatively narrow band of premiums or discounts, so using WTI as a barometer of all oil prices didn't cause much confusion or inaccuracy. The emergence of a pronounced and lengthy supply bottleneck at the Cushing, OK delivery location for the WTI futures contract has exploded this convenient set of relationships and assumptions.

Because more oil has been going into tankage at Cushing than was leaving those tanks over the last year or so, the price of WTI--itself a category, rather than a single stream of oil--has become massively depressed relative other types of crude oil, not just imported oil but also oil in other locations in the US that aren't affected by the bottleneck. Consider some important examples. While oil produced in Kansas, New Mexico and Oklahoma is all cheaper due to the Cushing effect, Louisiana Light Sweet, which historically traded within a dollar of WTI, is now worth nearly $20/bbl more, putting it much closer to the price of UK Brent crude--the best current gauge of global oil prices--than to WTI. Meanwhile, Bloomberg reports Alaskan North Slope crude (ANS) for delivery on the West Coast at nearly $107/bbl, or $24 over WTI. That's surprising, considering that ANS is heavier and higher in sulfur than WTI, and thus requires more processing. Just as remarkably, California heavy crude at Midway-Sunset is quoted at more than $10/bbl above WTI, when based on history and quality I would expect to see a discount of at least that magnitude. In other words, for now at least, the price of WTI is simply no longer representative of the crude that many US refineries are processing, from either foreign or domestic sources.

When you compare the wholesale price of gasoline from US refineries near the East, West and Gulf coasts to the cost of their crude inputs at around $100 or more, the difference of $15-17/bbl isn't historically unusual. Meanwhile, refineries in the middle of the country have recently been experiencing much stronger margins. This disparity is evident in the second quarter earnings reported by various US refining companies. East coast refiner Sunoco, which hasn't benefited much from cheap WTI, reported a net loss for the quarter, while Valero, with a bigger and more geographically dispersed refining system that includes facilities processing large quantities of WTI-related crude, saw refining segment earnings increase by 39% compared to the second quarter of 2010. The Cushing effect was even more pronounced for the recently merged HollyFrontier Corp., which apparently runs little crude that isn't priced near WTI and saw second-quarter net income almost triple versus 2Q2010. Even after that extra profit margin, gas prices in Tulsa, OK are currently as low as $3.30/gal., or about 15 cents per gallon less than the national average after adjusting for differences in state gas taxes.

Gasoline prices are determined by more than just crude oil prices, though in the long run the two must move together, because the latter represents the largest component of the cost of the former. At least until the bottleneck in Cushing is resolved by new pipeline capacity to the Gulf Coast, one option for which was just canceled, we will need to look beyond our old reliable WTI price indicator in order to compare gasoline and crude prices on a representative basis. I've been paying a lot more attention to the Brent market, and the Wall St. Journal still publishes daily prices for Louisiana Light Sweet and ANS. When and if those indices drop significantly, then it will be time to start looking for a commensurate drop in retail gasoline prices at the pump.

Monday, March 01, 2010

Oil Price Hangover

The price of oil is an odd thing. It's watched by millions of people every day, especially when it reaches uncomfortable levels, yet no two observers agree on all the details of how it's determined. Having traded the stuff professionally, I've always given a lot more credence to the fundamentals of supply and demand than to the influence of speculators as the main driver of day-to-day price movements, though it's clear that both supply and demand are pretty complex constructs in their own right these days. For some time, however, I've also been intrigued by the extent to which current oil prices seem to be affected by their own history, something more in keeping with behavioral economics than the kind I learned in grad school. When I consider all the factors converging to yield this morning's price for the prompt (April 2010 delivery) West Texas Intermediate crude oil futures contract, it's hard to rationalize a value just over $80 per barrel any other way, without taking into account that less than two years ago it was nearly $150 per barrel-- though just a year ago it stood at $40, after a dip into the mid-$30s.

Over the weekend I happened to look back at some scenario work I did almost six years ago, when oil prices were rising steadily but before they had passed the $50 per barrel mark for the first time. Though it seems hard to credit now, at the time even that milestone seemed nearly unimaginable for the group of energy industry managers participating in the workshop I was leading. WTI had just broken through $40/bbl, which represented the highest nominal oil price any of us had seen in our careers, a record set in the lead-up to the first Gulf War. Although the prices in the early 1980s, after the Iranian Revolution, were higher on an inflation-adjusted basis, we had just lived through a couple of decades in which oil had notably failed to keep up with general inflation. Of course from our current vantage point $40 or $50 now seems cheap, and that's precisely the point. With an all-time high of $145 still relatively fresh in memory for "anchoring" purposes, $80 might not seem low, but it hardly provokes the kind of anxious political pronouncements that flavored the 2008 US presidential campaign.

Things couldn't be more different than the first time we passed $80/bbl in September 2007, when there was much talk of the risk premium on oil prices due to tensions with Iran, as well as the impact of a weakening US dollar. Most importantly, the global economy was still booming and OPEC was having trouble keeping up with growing demand, particularly from the developing economies of China and the Middle East oil producers themselves, along with the US at the tail end of the bubble. By contrast, despite expectations for a recovery in 2010, today's oil market is dominated by weak demand, with average US demand for oil and its products in 2009 down by 10%, or 2 million barrels per day (MBD) from '07. The global appetite for oil fell by 1.5% in 2009, with only Asia and the Middle East registering any growth. Inventories are ample, refineries are running at extremely low rates of utilization--partly due to some ill-timed capacity increases--and OPEC has as much spare oil production capacity as it did in 2003, when WTI was in the $30s.

So why isn't oil back in the $30s or $40s, rather than the $70s and $80s, particularly with the dollar having strengthened by almost 6% since the beginning of the year? Certainly a big part of the credit or blame, depending on your perspective, belongs to OPEC, which has managed to take 2-3 MBD of production off the market and keep it there, with minimal cheating and without triggering a price war driven by members whose national budgets needed significantly higher oil prices or sales to balance. It's also clear that since the beginning of the last decade the marginal cost of incremental non-OPEC production has gone up significantly, whether from Canadian oil sands or deepwater Gulf of Mexico platforms. Part of that is due to the fact that these are intrinsically costlier barrels to produce, but it also owes a lot to the costs of raw materials and construction involved. Those soared during the last decade, weakening subsequently but not returning to their former levels. That means that the much lower oil prices we saw briefly at the end of 2008 and beginning of 2009 aren't sustainable for any length of time, though precisely where a realistic floor now lies is anyone's guess.

Arriving at a price of $80/bbl despite slack demand, ample global supply and a refining sector that's losing money doesn't require nefarious speculation, but it probably depends on two crucial factors: Most oil deals today are negotiated as a stated premium or discount relative to a handful of grades like WTI and Brent that involve as many financial players as refiners who must process the stuff and try to make a profit on it. And for those few, correspondingly more influential markets in which traders must negotiate an actual price and not just a differential, traders' price expectations are anchored by the history of the last couple of years. Once you've seen oil above $100 without the world ending--though it came close--you simply can't look at the market the same way you did before. If the range of possible prices is now seen as $40-$150, rather than $15-$35, today's circumstances understandably yield a mid-range interpretation, backed by an expectation that OPEC would intervene even more strongly if prices began falling towards that uncertain floor--a threat the credibility of which is greatly enhanced by OPEC's remarkable cohesion and discipline over the last year or so, perhaps providing more psychological anchoring in the form of availability bias.

So in a strange sort of way, we may still be experiencing the consequences of the extraordinary oil price spike of 2007-8, which was itself either an outgrowth of the global financial bubble, or a major, independent contributor to the ensuing collapse, in classic oil-shock fashion. While the extreme prices of that period have receded, they haven't vanished from the market's memory, and so they may continue to influence prices for some time to come, until the next spike or oil-price collapse resets them again.

Monday, November 16, 2009

Indexing Crude Prices

Although oil trading hasn't been my primary focus for many years, the recent announcement by Saudi Aramco that it is switching its price mechanism for oil delivered to the US caught my attention. Instead of basing its formula for deliveries here on the price of West Texas Intermediate crude oil, it will apparently reference the new Argus Sour Crude Index (ASCI.) While that lends substantial credibility to this new index and may gain Argus more than a few new subscribers, the implications for the widely-traded NYMEX WTI contract and the dynamics of the broader international oil market seem much less clear. In particular, I am skeptical of suggestions that this move could ultimately reduce whatever influence non-commercial financial participants--speculators, in common parlance--have on oil prices.

The question of how best to price crude oil for buyers and sellers is a perennial problem, particularly for oil that differs significantly in quality from the light, sweet grades behind the extremely liquid WTI and ICE Brent futures contracts. US refiners, in particular, have invested many billions of dollars in the hardware required to turn lower-quality oil into high-quality petroleum products. Any time the peculiarities of these contracts drag up the prices of the grades of oil they prefer to run, they grumble about basing deals on WTI. Likewise for sellers of sour crude, foreign and domestic, who suffer when the WTI price moves out of sync with world prices, such as when storage at its nexus at Cushing, OK fills up, as it did earlier this year. However, after listening to the Q&A podcast concerning the ASCI on Argus's website and reading the background document there, I'm skeptical that this index will settle the sour crude market's discontent, because it won't change the way this oil is traded by nearly as much as it might appear.

Without getting into all of its details, as I understand it the ASCI is effectively a composite daily report of the deals done for three specific streams of offshore Gulf of Mexico crude oil, all of which trade at a differential to WTI. In calculating a daily price, Argus will add the average daily discount or premium vs. WTI from the transactions it learns of to the daily price for WTI to come up with a single price in dollars per barrel. The Argus podcast was very clear that NYMEX WTI is still as the heart of the new index, not just because this reflects the way deals are done with reference to WTI, but also because WTI remains the highly-liquid futures contract that the buyers and sellers of the ASCI oil streams use to hedge their market risk. In other words, the new ASCI index is not a substitute for WTI-based pricing, but merely a more transparent gauge of the relationship between WTI and the sour crude market--though an index you have to pay to read falls a bit short of the kind of transparency currently provided by WTI itself.

What would happen if speculators drove up the price of WTI by $30/bbl? In theory, ASCI would reflect any disconnection between the fundamentals-based pricing of its included sour crude streams and the financially-driven WTI market by remaining more or less unchanged, after summing the combination of correspondingly wider discounts for the ASCI grades to the inflated daily WTI prices. Only by looking at the differentials themselves would we see any indication of distortion of the market by non-commercial players. But is that realistic? Consider that between January 2007 and July 2008, when the price of WTI rose more or less steadily from the mid-$50s to nearly $150/bbl, the discount between WTI and the monthly average refiner acquisition price for imported crude only widened from around $4.75/bbl to roughly $9/bbl. If WTI was being driven by speculation in that interval, differentials-based trading of the kind that ASCI will measure hardly insulated refiners from its effects.

That historical result might merely indicate that speculation had little real effect on the market in that period--a view to which I'm sympathetic--but it might just reflect the inertia of negotiated crude differentials. Either way, if you're Saudi Aramco and you're selling crude into the US based on ASCI, I'd conclude that your prices would still go up more or less in tandem with the NYMEX, despite the superficial "arms-length" mechanism flowing through ASCI. Perhaps I've missed some subtlety in the mechanism.

From what I can tell, neither ASCI nor the prospect of new futures contracts based on it addresses the underlying concerns I have had since the industry migrated to pricing based on differentials against the WTI and Brent futures contracts, and away from negotiating actual "fixed and flat" prices for each cargo or pipeline deal, back when I was trading oil in the 1980s and early 1990s. While that shift made life much easier for risk managers and took a lot of heat off traders to strike the best deal on any given day, it also opened the door to a host of other influences on pricing that I still don't think we entirely understand.

The market will pass its own judgment on ASCI and other new tools like it. If it proves useful to traders and risk managers, it could become the new industry standard, as Argus must hope, having made such a big splash over its launch. If it's not useful, it will fade into the background, becoming just another dataset in an already bewildering sea of energy-related information. With Gulf of Mexico output booming and more discoveries yet to be made, it looks like a reasonable bet to join other useful physical crude indices around the world. But anyone hoping it will shine a beacon on speculators in the next oil price spike is likely to be disappointed by the core of a system still rooted in WTI, the speculative influences over which remain uncertain and possibly unprovable.

Tuesday, April 24, 2007

Benchmark At Sea?

Since reading the Wall Street Journal's analysis of the growing disconnection between the industry's West Texas Intermediate (WTI) crude oil benchmark and the actual crudes that refineries purchase and process, I've been pondering this latest version of a fairly old problem. Although current concerns about supply, demand and capacity in the Mid-Continent have made hedging with WTI more problematic than usual, anyone engaged in this sort of risk management--or speculation--must surely understand that the "basis risk" has always been subject to unpredictable swings from local factors, as well as the larger shifts of the global oil market. At the same time, market professionals have been concerned for two decades about the potential for WTI to become irrelevant in a world of disproportionately heavy and sour future oil production.

Although all of my oil trading experience was in the dark ages before the Internet, when orders were placed by phone, rather than on a screen, some aspects of the business haven't changed. As the Journal rightly points out, the physical oil at the heart of WTI trading still represents a shrinking and increasingly unrepresentative sample of global crude oil grades, many of which are heavier and higher in sulfur and other impurities, rendering them harder to refine and thus less valuable. That never stopped crude sellers from pegging their prices to WTI, including the heavier, somewhat more sour Californian and Alaskan crudes I traded in the late 1980s and early 1990s. In hedging San Joaquin Valley Heavy crude with WTI, the basis risk--reflecting the correlation between the price of thing being hedged and the instrument with which it was hedged--could be nearly as large as the total market risk.

The circumstances described in the article are an extreme case of this phenomenon, in which a temporary glut of crude oil in Cushing, OK, the delivery point for the WTI contract, has detached the WTI price from the world price, as represented by the price of Brent Crude from the North Sea. Historically selling at a discount to WTI, Brent is now roughly $2.50/barrel higher, reflecting conditions in the larger market outside Oklahoma. But in assessing whether this is a temporary problem or a long-term shift, it's important to realize that WTI at Cushing, OK isn't quite as stranded or inflexible as the Journal indicates. A quick review of the terms for WTI on the NY Mercantile Exchange shows that a variety of crude oil types can be delivered in satisfaction of the contract, including other sweet crudes from the US, Colombia, Nigeria, Norway and the UK. The contract also provides for an "alternative delivery procedure," which could include other locations besides Cushing. If there's one thing physical oil traders know how to do, it is negotiating location differentials.

Nor is the arbitrage between storage and future delivery quite the permanent feature the author suggests. It only works when the market is in "contango", with future prices higher than current prices, typical of an oversupplied market. But over the long haul, the market is more often in "backwardation", with future prices falling off from current levels. Speculators playing this "front-to-back arb" are exposed to a sudden shift from one state of the market toward the other, and anyone thinking contango is a perpetual motion machine is in for a rude surprise.

So at least part of the problem described by the Journal looks like a transient and a normal part of market risk--another good reason for those who know little about oil fundamentals to forgo dabbling in oil futures. However, this doesn't alter the underlying problem that most of the oil that will be produced in the future will look a lot less like WTI than most of the oil that's already been produced. Explorationists have had a remarkable run for the last 20 years, finding more sweet crude than anyone expected in places like West Africa, the North Sea, and the deep waters of the Gulf of Mexico. But the odds against continuing that streak get worse each year, with the preponderance of global reserves lying in the Middle East, where oil is typically heavier and higher in sulfur and than WTI. The need for a sour crude benchmark similar to what WTI and Brent provide for sweet crudes has existed for a long time, and it will continue to grow.

But here we run into a Catch-22. Launching a new futures contract isn't easy, especially when many of the parties that could provide the liquidity necessary to lure major oil companies and other conservative players into a new market have vested interests in seeing a "sour contract" fail, as NYMEX's previous attempt in the 1980s did. If your firm is making good money writing over-the-counter swaps for illiquid and much less transparently-priced commodities, why would you want to help put this activity out of business by encouraging a transparent, liquid and flexible exchange-traded sour crude contract with low transaction fees? The only thing I see changing this calculus is if the problems at Cushing grow large enough to make the basis risk unmanageable for both sides of the transaction, eroding the profits of market makers, as well as hedgers. The Journal seems to be saying we're at that point, but I've heard that before.

What does this mean to the average person? For starters, it reduces the importance we should place on that part of the media's energy coverage--not that there was much benefit in following day-to-day changes in the WTI price, before. At the same time, investors in the energy sector may want to broaden the indicators they follow, to include more of grades that refineries actually run. That will require a little more legwork. If the new Middle East Sour contracts on the ICE and the Dubai Mercantile Exchange actually take off, that task will be easier.