Showing posts with label tight oil. Show all posts

Thursday, November 06, 2014

Will Falling Prices Shift Oil Industry's Focus to Cost Reduction?

  • Lower oil prices may have less impact on US oil production from shale than competitors in Saudi Arabia and elsewhere appear to assume.
  • The cost of  producing tight oil is not static, and US producers have various options for cost reduction, including optimizing their logistics. The newly elected Congress can help.
Oil prices have dropped by more than 20% since July, based on futures contracts for UK Brent crude. Some expect prices to rebound relatively quickly, apparently including at least one large oil services company. However, indications that the official policy of Saudi Arabia may have shifted away from its customary role of "swing producer" raise the possibility of an extended period of lower prices. This is new territory for the relatively young US shale industry.

From the end of 2010 to the first half of this year, as the rapid development of light tight oil (LTO) from shale deposits was adding more than 2.9 million barrels per day (bpd) to US output, the benchmark price of West Texas Intermediate crude oil (WTI) averaged $96/bbl. The global oil price, represented by UK Brent, averaged $110/bbl for the same period. Having now fallen to the $80s, if prices were to stay here or lower for long, we should expect to learn a great deal about the actual cost structure of new and existing LTO production in the Bakken, Eagle Ford, Permian Basin and other shale plays.

Based on my experience of several oil-price declines from the inside during my time at Texaco, Inc., I'm skeptical that many LTO producers would be inclined to trim output from currently producing wells, other than as a last resort. From late 1997 to the end of '98, WTI prices fell by almost half, from around $20/bbl to under $11--equivalent to roughly $15 today.  Prices for heavier grades of oil fell to single digits. After months of that, revenues from some oil fields no longer covered variable costs, and upstream management took the decision to shut in high-cost production. Once prices revived, they discovered that some of that capacity had been lost essentially permanently.

I suspect there would be even greater uncertainty and hesitation today about shutting in producing shale wells for any significant period, especially in light of the limited experience with such wells. The bigger question is whether the drilling of new wells would slow or stop, resulting in a gradual slide in output as existing wells decline.

Then and presumably now, however, the first option in a situation like this is generally to cut costs, rather than output. I saw this in the mid-1980s, when oil prices fell by nearly 60% and took more than a decade to recover fully, then again in the late '90s, and during periodic, smaller market corrections. Suppliers were squeezed, big projects deferred, and employees saw travel, raises and benefits curtailed. Similar actions now could make a difference in keeping new shale drilling going.

Even for relatively efficient operators, it can be surprising how much expense can be reduced without affecting near-term productivity, and many of those savings would persist if prices recovered. LTO producers might ultimately become more profitable after weathering a period of weak prices.

A heightened focus on costs would also likely extend beyond producing company budgets and supplier agreements. One of the biggest non-production costs for LTO is transportation, whether paid directly by the producer or deducted by the purchaser from the market price.  Because of its rapid growth and the constraints of existing infrastructure, a high proportion of LTO output must currently be shipped by rail--up to one million bpd in the second quarter of 2014.

Rail offers flexibility and can reach many destinations, but it is expensive.  For example, if it costs over $10/bbl to ship Bakken crude to the Gulf Coast by rail, that means that with WTI at $78/bbl the producer might realize less than $70/bbl at the wellhead.  Pipelines are often cheaper to use, though not in all cases. The current tariff on the existing Keystone Pipeline for taking oil from the Canadian border to Cushing, OK, the storage hub for WTI, works out to around $4/bbl. If oil prices stayed low for a while, that might increase interest in the proposed Bakken Marketlink Project. It would connect the Bakken shale operations to the Keystone XL pipeline, the prospects for which look decidedly better after the outcome of Tuesday's mid-term election.

Another aspect of transportation costs that could come under a different kind of pressure relates to federal restrictions on shipping oil and petroleum products by vessel between US ports. Under the "Jones Act", only US-flagged, -owned and -crewed ships can perform such deliveries, even though the rates for such shipments are normally significantly higher than on foreign-flag tankers in comparable service. This is a significant factor in current petroleum trade patterns, in which refined products from Gulf Coast refineries are often shipped halfway around the world, while blenders and marketers on the east and west coasts must import gasoline and other products from outside North America.

And as long as US crude oil exports are prohibited, with a few exceptions, the combination of the Jones Act and the export ban effectively keep LTO bottled up on the Gulf Coast--depressing its price--or force it onto rail. Amending the Jones Act to exempt LTO, or the issuance of a waiver to that effect from the Executive Branch, could increase producers' margins while expanding the supply options for US refineries on the other coasts. I wouldn't be surprised to see this taken up by the new Congress early next year.

 Based on the current behavior of oil markets, the global impact of the US shale oil boom has been greater than many expected and seems very much in the national interest of the US--and of US consumers--to keep it going. It remains to be seen whether measures such as new pipeline infrastructure and reform of shipping regulations, together with more traditional forms of expense reduction, could boost producers' returns on LTO sufficiently to sustain drilling at roughly current rates while oil prices are weak. 

Even if both drilling and tight oil production slowed for a while, this price correction won't spell the end of the shale boom. As the Heard on the Street column in the Wall Street Journal put it recently, "Once someone has cracked it, it can't be unlearned. Barring a prolonged period of very low prices, the US oil industry isn't about to disintegrate." Rather than an existential crisis, the current weakness in oil markets looks like a test of adaptability for this new but important energy sector.

A different version of this posting was previously published on the website of Pacific Energy Development Corporation.

Wednesday, October 15, 2014

The Impact of the Global "Sweet" Crude Bulge

  • The recent slide in global oil prices has been compounded by the pressure that rising US shale oil production is putting on the price of sweet crude benchmarks like Brent.
  • OPEC's producers may suffer as much as those in the US, while consumers benefit from significantly lower fuel prices than last year.
When the US went to war in Iraq in 2003, the price of oil embarked on a trend that took it from around $30 per barrel to nearly $150 before collapsing in the recession in 2008. This time, as a new US-led coalition takes on ISIS with a bombing campaign in Iraq and Syria, the price of oil is falling, down 20% in the last two months. It's not just that global economic growth has weakened recently, or that soaring shale oil output in the US has averted another oil crisis. Oil's current downturn also reflects the fact that new production from the Bakken, Eagle Ford and other shale deposits is particularly well-suited to undermine oil's global benchmark prices, for Brent and West Texas Intermediate, both of which are made up of light sweet crude oil streams.

The numbers for US shale, or "light tight oil" (LTO) as it's often called, are impressive, especially to those accustomed to watching the gradual ebb and flow of different oil sources over long periods. In the 12 months ending in June 2014, US oil production grew by 1.3 million barrels per day (MBD), not far short of Libya's pre-revolution exports. Since January 2011, the US added 3 MBD, or about what the UK produced at its peak in 1999. In fact, since 2010 incremental US LTO production has exceeded the net decline of the entire North Sea (Denmark, Norway and UK) by around 2 MBD, contributing to a significant expansion of Atlantic Basin light sweet crude supply.

The New York Mercantile Exchange defines light sweet crude as having sulfur content below 0.42% and an API gravity between 37 and 42 degrees. That's less dense than light olive oil. The specification for Brent is similar. Much of the LTO produced from US shale formations fits those specifications, and what doesn't is typically even lighter and lower in sulfur.

The current "contango" in Brent pricing, in which contracts for later delivery sell for more than those for delivery in the next month or two, is another sign of a market that is physically over-supplied: more oil than refineries want to process, with the excess going into storage. However we also see indications that the historical premium assigned to lighter, sweeter crude versus heavier, higher-sulfur crude is under pressure.

One example of this is the gap or "differential" between Louisiana Light Sweet, which wasn't caught up in the delivery problems that plagued West Texas Intermediate for the last several years, and Mars blend, a sour crude mix from platforms in the Gulf of Mexico. From 2007-13 LLS averaged around $4.50 per barrel higher than Mars, while for the first half of this year it was only $2.75 higher and today stands at around $3.40 over Mars.

And while OPEC's reported Reference Basket price has been falling in tandem with Brent, its discount to Brent had also narrowed by about $1 per barrel, prior to the price plunge of the last couple of weeks, compared with the average for 2007-13. Considering that OPEC's basket includes light sweet crudes from Algeria, Libya and Nigeria that sell into some of the same Atlantic Basin markets as Brent, that looks significant.

By itself a narrowing of the sweet/sour "spread" of only a dollar or so per barrel isn't earth-shattering. However, because the surge of US oil production is effectively focused on the oil market segment represented by the price of Brent, it compounds the pressure on OPEC, many of whose members link the price of their output to Brent. This might help explain why the response of OPEC's leading producer, Saudi Arabia, has been to cut prices rather than output, in an apparent effort to maintain market share rather than price level.

The Saudis know better than anyone how that movie could end. The Kingdom's1986 decision to implement "netback pricing", linking the price of its oil to the value of its customers' refined petroleum products, helped precipitate a price collapse so deep that it took oil prices 18 years to reach $30/bbl again, by which time the dollar had lost a third of its value.

Whether aimed at US shale producers or as a reminder to the rest of OPEC, which appears to be unprepared to make the output cuts necessary to defend higher oil prices, the Saudi action increases the chances that oil prices will over-correct to the downside, rather than rebounding quickly. If so, the impact of the sweet crude bulge in the Atlantic Basin--only a little more than 3% of global oil supplies--could play a disproportionate role in prolonging the pain producers will experience until oil markets eventually reach a new equilibrium.

In the meantime, US consumers are benefiting from gasoline prices that are already $0.15 per gallon lower than this week last year. Today's wholesale gasoline futures price for November equates to an average retail price well below $3.00 per gallon, after factoring in fuel taxes and dealer margins, compared to last year's average retail price for November of $3.24. After factoring in lower diesel and heating oil prices, the fall in oil prices could put an extra $10 billion in shoppers' pockets for this year's holiday season.

A substantially different version of this post was previously published on the website of Pacific Energy Development Corporation

Wednesday, August 06, 2014

The Missing Oil Crisis of 2014

  • While the full impact of the surge in US "tight oil" may be masked by problems elsewhere, it is on the same scale--but opposite direction--as key factors that led to the 2007-8 oil price spike.
  • In that light it does not seem like hyperbole to credit the recent revival of US oil output with averting another global oil crisis.
Several speakers at last month's annual EIA Energy Conference in Washington, DC reminded the audience that energy security extends beyond oil, starting with Maria van der Hoeven, Executive Director of the International Energy Agency (IEA). In her keynote remarks Monday morning she was quick to point out that it also encompasses electricity, sustainability, and energy's effects on the climate and vice versa. Still, the comment that got my wheels turning came from Dan Yergin, author and Vice Chairman of IHS. During his lunch keynote he suggested that without US tight oil production, this year's conference would have been dominated by another oil crisis.

Although shale energy development certainly deserves to be called revolutionary, crediting it with averting an oil crisis calls for a bit of "show me." Yet with problems in Libya, Nigeria and Iraq, while Iranian oil remains under sanctions and oil demand picks up again, even at first glance Mr. Yergin's assertion looks like more than a casual, lunch-speech sound-bite.

Start with current US tight oil (LTO) production of over 3 million barrels per day (MBD) and estimates of future LTO production rising to as much as 8 MBD--also the subject of much discussion at the conference. As recently as 2008 total US crude oil output had fallen to just 5 MBD and was only expected to recover to around 6 MBD by 2014, with minimal contribution from unconventional oil. Instead, the US is on track to beat 2013's 22-year record of 7.4 MBD, perhaps by as much as another million bbl/day.

With conventional production in Alaska and California declining or at best flat, and with Gulf of Mexico output just starting to recover from the post-Deepwater Horizon drilling moratorium and subsequent "permitorium", the net increase in US crude production attributable to LTO today is in the range of 2.5-3.5 MBD and growing, thanks to soaring output in North Dakota, Texas and other states.

That might not sound like much in a global oil market of over 90 MBD, but it brackets the IEA's latest estimate of OPEC's effective unused production capacity of 3.3 MBD. Spare capacity and changes in inventory are key measures of how much slack the oil market has at any time. When OPEC spare capacity fell below 2 MBD in 2007-8, oil prices rose sharply from around $70 per barrel to their all-time nominal high of $145 per barrel. It took a global recession and financial crisis to extinguish that price spike, and high oil prices were likely a major contributor to the recession.

Global oil inventories are now a little below their seasonal average for this time of the year. Compensating for the absence of over 3 MBD of US tight oil would require higher production elsewhere, lower demand, or a drain on those inventories that would by itself push prices steadily higher.

Concerning production, if the US tight oil boom hadn't happened, more investment might have flowed to other exploration and production opportunities. However, for non-LTO production to have grown by an extra 3 MBD, companies would have had to invest--starting in the middle of the last decade--in the projects necessary to deliver that oil now. Were that many deepwater and conventional onshore projects deferred or canceled because companies anticipated today's level of LTO production more than 5 years ago? And would Iraq, Libya and Nigeria be more reliable suppliers today if US companies hadn't been drilling thousands of wells in shale formations for the last several years? Both propositions seem doubtful.

As for adjustments in demand, US petroleum consumption is  already over 8% less than in 2007. And as we learned in the run-up to 2008, much of the oil demand in the developing world, where it has grown fastest, is less sensitive to changes in oil prices than demand in developed countries, due to high levels of consumer petroleum subsidies in the former. Petroleum product prices in the latter must increase significantly in order to get consumers there to cut their usage by enough to balance tight global supplies. That dynamic played an important role in oil prices coming very close to $150 per barrel six years ago, when average retail unleaded regular in the US peaked at $4.11 per gallon, equivalent to nearly $4.50 per gallon today.

So to summarize, if the US tight oil boom hadn't happened, it's unlikely that other non-OPEC production would have increased by a similar amount in the meantime, or that OPEC would have the capability or inclination to make up the resulting shortfall versus current demand out of its spare capacity. Demand would have had to adjust lower, and that only happens when oil and product prices rise significantly. With oil already at $100 per barrel, it's not hard to imagine such a scenario adding at least $40 to oil prices--just over half the 2007-8 spike. Combined with higher net oil imports, that would have expanded this year's US trade deficit by around $230 billion. US gasoline prices today would average near $4.60 per gallon, instead of $3.54, taking an extra $140 billion a year out of consumers' pockets.

We can never be certain about what would have happened without the current surge in US tight oil, but for a reminder of how a similar situation was characterized just a few years ago, please Google "2008 oil crisis".  If we found ourselves in similar circumstances today, then the heated Congressional hearings and angry consumers to which Mr. Yergin alluded in his remarks would almost certainly have been major topics at EIA's 2014 conference, instead of the realistic prospect of legalized US oil exports.

A different version of this posting was previously published on the website of Pacific Energy Development Corporation.

Friday, July 18, 2014

Condensate Pries Open the Oil Export Lid

  •  A US ruling to allow limited exports of condensate, a light hydrocarbon mix similar to light crude oil, has implications for both producers and refiners, though not consumers.

  • Whether or not it leads to wider US exports of condensate and crude, it signals just how much the US energy situation has changed since the oil export ban was first imposed.

Last month we learned that the US Commerce Department gave two US companies permission to export condensate that would otherwise be trapped here under a 1970s-vintage ban on US oil exports. This validates the view, as described in a white paper from the office of Senator Lisa Murkowski (R-AK) earlier this year, that the administration has the statutory authority necessary to allow such exports. An entire session at this week's annual EIA Energy Conference was devoted to the details of this ruling, and whether it paves the way for broader exports of a growing US surplus of condensate and light sweet crude oil.

Over the past several decades US refineries invested an estimated $100 billion to enable them to process the increasingly heavy and sour crude oil types available for import. As a result, most US refineries, particularly on the Gulf and west coasts, are no longer equipped to run large volumes of the extremely light condensates and oils now coming from onshore shale deposits. Allowing producers to achieve world-market prices for their output should boost the economy and raise tax receipts, yet is unlikely to harm consumers.

Condensates are a class of hydrocarbons distinct from crude oil, though they share enough oil-like characteristics frequently to be lumped in with the latter, as in US export regulations. The technical definition of condensates encompasses both the “natural gasoline” extracted during the processing of natural gas produced from oil fields (“associated gas”,) as well as the heaviest liquids separated from “non-associated” gas, i.e. from gas fields, rather than oil fields.

The condensate being exported in this case comes mainly from liquids-rich shale deposits like the Eagle Ford in Texas, which produces varying proportions of dry gas, “wet” gas containing NGLs and condensate, and crude oil, depending on well location. Condensate apparently accounts for around 20-40% of Eagle Ford “tight oil” output.

Condensate mainly consists of natural gas liquids like ethane, propane and butane, along with substantial quantities of naphtha, a low-octane mix of hydrocarbons that boils in the gasoline range, plus much smaller proportions of diesel and heavier “gas oils” than would be typical of crude oil. The naphtha in condensate can sometimes be blended into gasoline, depending on its specific qualities, or processed in a refinery to yield higher-quality gasoline components.

Subsequent to the phase-out of tetraethyl lead, most gasoline from US refineries has been a blend of higher-octane naphtha produced by catalytic cracking units and the “reformate” from catalytic reforming units, with provision for further blending during distribution with up to 10% ethanol. Last month US refineries set an all-time record for gasoline production, at over 10 million barrels per day. They are unlikely to miss the naphtha exported in condensate.

Historically, the global market for condensate has had important distinctions from the broader crude oil market, based on the inherent characteristics of these liquids and the end-users seeking them. Refiners running mainly heavy oils sometimes buy condensate for blending, to lighten their average inputs and fill gaps in their processing capacities.

With the Gulf Coast now drowning in light “tight oil” from shale, this is becoming too much of a good thing, as refiners increasingly have more light material in their feedstock than their facilities can easily handle. One presenter at the EIA conference described the situation as building toward a "day of reckoning", when the discounts required to induce US refiners to process excess light crude instead of imported heavier crude would reach the level at which producers must throttle back oil production. Another expert with whom I spoke was adamant that that day of reckoning has already arrived. One result is investment in new facilities to provide minimal processing–really just distillation–for condensate.

By contrast, petrochemical producers, particularly in Asia, are expected to import growing volumes of condensate for use in the production of olefins like ethylene and propylene, and aromatics like toluene and benzene, from which to make plastics, solvents and other petrochemicals. In that market, US condensate will compete with condensate from other gas producing nations, and with exports of refinery naphtha from Europe and elsewhere. This looks like a good opportunity for US producers.

Some advocates of lifting the ban on crude oil exports see the Commerce Department’s ruling as a precedent for allowing exports of all types of oil, or at least a good first step. However, other reports have focused on this ruling as an end-run around the export rules by redefining minimally processed condensates as a petroleum product, and thus exempt from the ban. In that view, the resulting precedent from condensates for exports of true crude oil may be weaker than that from ongoing, permitted oil exports to Canada.

Either way, allowing condensate exports is a smart move that, if continued, should ease crude congestion on the Gulf Coast and reduce the discounts that could make domestic oil less economical to produce, to the benefit of foreign suppliers. It might even push the problem beyond the current election year and enable Congress to consider normalizing all oil exports without the inhibiting effect of populist pressures at the polls. In the meantime, you can bet these condensate exports will be closely scrutinized for any noticeable effects, good or bad.

A different version of this posting was previously published on Energy Trends Insider.

Wednesday, March 19, 2014

Making Oil-by-Rail Safer

  • A series of rail accidents involving trains carrying crude oil has focused attention on safety procedures and even the tank cars used in this service.
  • Another concern is the variable characteristics of the "light tight oil "now shipped by rail in large quantities. That isn't the result of "fracking", but of the oil's inherent chemistry.   
The growth of North American oil production from unconventional sources has resulted in a dramatic expansion in the volume of crude oil shipped by rail. Unfortunately, as crude oil rail traffic has increased, so have rail accidents involving crude oil, including the tragic explosion and fire in Lac-Megantic, Quebec last July. That event and subsequent accidents have focused railroads, regulators and shippers on the need to improve the safety of oil-by-rail as quickly as possible.

In the immediate aftermath of Lac-Megantic, the Federal Railroad Administration issued an emergency order on procedures railroads must follow when transporting flammable and other hazardous materials. And on February 21, 2014 railroads reached a voluntary agreement with the US Department of Transportation (DOT) on additional steps, including reduced speed limits for oil trains passing through cities, increased track inspection, and upgraded response plans. These steps have the highest priority, because crude oil loaded in tank cars doesn't cause rail accidents. Every incident I've seen reported in the last year began with a derailment or similar event.

At the same time, the packaging and characteristics of the oil can affect the severity of an accident.  Investigators have focused on two specific issues in this regard, starting with the structural integrity of the tank cars carrying the oil. The vast majority of tank cars in this service are designated as DOT-111--essentially unpressurized and normally non-insulated cylinders on wheels. These cars routinely carry a variety of cargoes aside from crude oil, including gasoline and other petroleum products, ethanol, caustic soda, sulfuric acid, hydrogen peroxide, and other chemicals and petrochemicals.

Their basic design goes back decades, and even the older DOT-111s incorporate learnings from earlier accidents. A growing proportion of the US fleet of around 37,000 DOT-111 tank cars in oil service consists of post-2011, upgraded cars that have been strengthened to resist punctures, but the majority is still made up of older, unreinforced models. The Pipeline and Hazardous Materials Safety Administration (PHMSA) is studying whether to make upgrades mandatory, but some railroads and shippers aren't waiting. Last month Burlington Northern Santa Fe Railway, owned by Warren Buffet's Berkshire Hathaway, announced it would buy up to 5,000 new, more accident-resistant tank cars.

Another issue that has received much attention since Lac-Megantic concerns the flammability of the light crude from shale formations like North Dakota's Bakken crude, which accounts for over 700,000 barrels per day of US crude-by-rail. The Wall Street Journal published the results of its own investigation, reporting that Bakken crude had a higher vapor pressure--a  measure of volatility and an indicator of flammability--than many other common crude oil types.

The Journal apparently based its findings on crude oil assay test data assembled by the Capline Pipeline.  Although a Reid Vapor Pressure of over 8 pounds per square inch (psi) for Bakken crude is higher than for typical US crudes, it's not unusual for oil as light as this. That's especially true where, due to lack of field infrastructure, only the co-produced natural gas is separated out, leaving all liquids in the crude oil stream.

What makes this situation unfamiliar in the US is that domestic production of oil as light as Bakken had nearly disappeared before the techniques of precision horizontal drilling and hydraulic fracturing were applied to the Bakken shale and similar "source rock" deposits. (Note: High vapor pressures are characteristic of the naturally-occurring mix of hydrocarbons in very light crudes, rather than a result of the "fracking" process.) Nor is the reported vapor pressure for Bakken or Eagle Ford crude higher than that of gasoline, a product that is federally certified for transportation in the same DOT-111 tank cars that carry crude oil.

The variability of the vapor pressure data that the Journal's reporters identified for Bakken crude may result from another unfamiliar feature of such "light tight oil". Crude produced from conventional reservoirs, which are much more porous than the Bakken shale, tends to be relatively homogeneous. However, because the Bakken and other shales are so much less porous, limiting diffusion within the source rock reservoir, the composition of their liquids can vary much more between wells.

In any case, vapor pressure isn't the preferred measure of fuel flammability. Actual rail cargo classifications are based on flash point and initial boiling point. These routine quality tests aren't included in Capline's publicly available data. PHMSA initiated "Operation Classification" to ensure that manifests and tank car placards for crude oil shipments accurately reflect the potential hazards of each cargo, based on such measurements. The agency has determined that it hasn't always been done consistently, and DOT issued another emergency order requiring shippers to test oil for proper classification.

As mentioned in an oil-by-rail webinar yesterday, hosted by Argus Media, assigning the proper classification to oil shipments may seem like a bureaucratic concern--it doesn't necessarily affect the tank car type chosen to transport the crude--but it can have a significant impact on operational factors such as routing and the notification of first responders along the route.

There's no quick and simple way to make the transportation of crude oil by rail as safe as hauling a dry bulk cargo like grain. Tank car fleets can't be replaced overnight, not just because of the cost involved, but due to limited manufacturing capacity. However, in the meantime significant improvements can be achieved through a combination of government attention and sustained industry initiatives. Since the new crude streams traveling by rail play a key role in increasing North America's energy security, this is in the interest of everyone involved--producers, shippers, railroads, and not least the communities through which this oil travels.

A different version of this posting was previously published on the website of Pacific Energy Development Corporation.
 

Thursday, July 11, 2013

Global Shale Oil and Gas Estimates Expand

  • The Department of Energy's revised shale resource estimates shed new light on the global extent of shale gas and especially shale oil potential.
  • While in the US shale gas preceded large-scale shale oil development, other countries may find fewer obstacles for the latter, and an eager market.
Recently revised estimates of global shale oil and gas resources from the Energy Information Administration (EIA) of the US Department of Energy represent a significant increase over the EIA's 2011 estimates.  Technically recoverable shale oil (tight oil) grew more than tenfold, due to the inclusion of formations outside the US, while estimated global shale gas resources rose by 10%. With these revisions, shale formations now constitute 10% of global crude oil resources and nearly a third of global natural gas resources, although the actual impact of these resources on production and markets is still likely to vary greatly from region to region and country to country.

This year's report reflects a greater focus on tight oil, incorporating insights from the significant development of US tight oil resources that has occurred since the previous report was published. Tight oil development is largely responsible for the 19% increase in US crude oil production from 2010 to 2012.  The smaller adjustment to shale gas is the net result of downward revisions for some countries assessed in 2011, such as Poland and Norway, together with the inclusion of resources in additional shale formations and countries, including Russia, Indonesia and Thailand.

The EIA and the consulting firm that prepared the report were careful to differentiate the technically recoverable resources (TRRs) identified in this data from the more restrictive categories of economically recoverable resources and proved reserves. In other words, these figures represent the quantities of oil and gas that could be recovered if prices justified development and infrastructure was available to carry them to market, not the amounts that producers currently plan to develop.  At the same time, these estimates constitute only a small fraction--at little as 5-25%--of the oil and gas thought to be present in the assessed shale deposits.  Further improvements in technology could substantially increase future TRRs. 

It's interesting to note that although the US leads the world in production of both tight oil and shale gas, it ranks second and fourth, respectively, in global resources of these fuels.  The report also indicates that estimated US tight oil resources of 58 billion barrels (bbl) are more than double current proved oil reserves, which represent just under 7 years of current production.  That's significant, because a sizable fraction of the 139 billion bbls of US conventional unproved TRR--non-shale crude oil not currently included in proved reserves--sits in onshore and offshore areas currently off-limits to drilling. So shale provides a pathway for US oil production to sustain higher output than in the recent past, without having to overcome barriers such as those impeding development offshore California or in the Arctic National Wildlife Refuge. 

Or consider Russia, for which the report cites proved reserves equivalent to 21 years of production and slightly exceeding tight oil TRRs.  Russia possesses many of the factors conducive to shale development, including a large drilling fleet and an oil industry accustomed to drilling large numbers of wells, along with oil-transportation infrastructure. It remains to be seen whether Rosneft and other producers will choose to develop the Bazhenov shale and other deposits rapidly, to increase total output and exports, or more gradually, to offset declines in mature fields and maintain current production rates.

The EIA also reported 32 billion bbls of tight oil TRR in China.  Conventional reserves are comparable to those of the US, supporting current production less than half America's.  Without tight oil, China's economic expansion and the rapid growth of its vehicle fleet put it on track to displace the US as the world's largest oil importer within a few years.  China-based companies are seeking oil in Africa, South America and North America, so it's hard to envision them leaving their own shale resources undeveloped. 

The situation is more complicated for shale-rich OPEC members like Libya and Venezuela.  For example, aside from its current political instability, Libya has nearly 90 years of conventional oil reserves at its current OPEC quota of around 1.5 million bbl/day, before considering the 26 billion bbls of tight oil identified by the EIA.

On balance, the latest EIA shale resource assessment presents a wider and more realistic view of shale outside the US than in 2011. That includes tempering some of the previous report's enthusiasm for shale gas prospects in places like Poland, where few wells had been drilled until recently. The new element is the report's portrayal of the tight oil resource base as broad and deep, centered mainly on countries likely to be motivated to develop it. The shale gas revolution may be slow to spread globally, due to much-discussed differences in the conditions for development, compared to those in the US.  By contrast the development of shale oil, or tight oil, faces fewer obstacles and an eager market.

A slightly different version of this posting was previously published on the website of Pacific Energy Development Corporation.

Friday, June 07, 2013

Could US Oil Trends Alter How Oil Prices Are Set?

  • Oil prices weren't always set by a transparent global market. Current pricing mechanisms emerged from much less transparent precursors.
  • Resurgent US production, combined with restrictions on US oil exports, could disconnect the US from the global oil market, with unexpected results.
If you follow energy closely, you've likely lost count of the number of times you've heard an economist, executive or government official explain that oil prices are set by the global market, and not by oil companies or the US government.  Although somewhat over-simplified, this statement has been valid for roughly 30 years.  However, it hasn't always been the case. Current trends in US production, together with existing regulations, make me wonder if it will remain accurate in the future, as the US inches closer to what is commonly referred to as energy independence. 

The market-based system of oil prices, with its transparency and easy trading among regions, didn't appear overnight.  Until the early 1970s, Texas played a role similar to Saudi Arabia's current swing producer role within OPEC.  By limiting the output of the state's oil wells, the Texas Railroad Commission effectively determined the global price of oil--to the extent there was one--until Texas had no spare capacity left.  That set the stage for OPEC, a succession of oil crises, and the US oil price controls that were imposed in the 1970s in an attempt to help manage inflation. There was also no single, representative oil price.  Instead, prices were set by producers' contract terms and the discounts large refiners could negotiate, or by federal regulations.  The current system emerged from a series of developments in the 1980s.

When US oil price controls ended in 1981, oil futures trading was just getting underway on the New York Mercantile Exchange.  The heating oil contract was launched in 1980, followed by the West Texas Intermediate (WTI) crude oil contract in 1983. This combined large-scale oil trading with an unprecedented level of transparency.   It was also significant that the US, the world's biggest oil consumer, had become a major oil importer after domestic production peaked in 1970.  Because refineries on the coasts competed for oil supplies with refiners on other continents, the price of WTI couldn't get too far out of line with imported crudes without creating arbitrage opportunities for traders.  And any part of the US connected by pipeline to the Gulf Coast was effectively linked to oil prices in Europe, the Middle East and Asia.

After OPEC miscalculated the response to the very high prices its members were demanding in that period--reaching $100 per barrel in today's dollars--global oil demand shrank by nearly 10% from 1979 to 1983, while non-OPEC production grew by more than 12%.  Prices soon collapsed, and OPEC's dominance of oil markets faded for most of the next two decades, during which the futures exchanges and trading relationships of the modern oil market took hold. 

What could shake the current system of oil prices?  It has already withstood recessions, wars in the Middle East, the collapse of the Soviet Union, and the explosive growth of Asia, with China alone adding oil demand comparable to that of the EU's five largest economies.  However, since the current system is based on the free flow of oil between regions, anything that impedes that flow could undermine the way oil is currently priced.

Setting aside conflict scenarios, consider the potential impact of sustained growth in US production, combined with flat or declining demand and no change in the current prohibition on most US crude oil exports.  The gyrating differential between WTI and UK Brent crude, reflecting rising production in the mid-continent and serious logistical bottlenecks, provides a glimpse of what this could be like.  With much of the new US production coming in the form of oils lighter than those for which most Gulf Coast refineries have been optimized, keeping rising US crude output bottled up here could result in US crude prices diverging even farther  from global prices, while forcing US refineries to operate less efficiently and import and export more refined products.  With oil imports drastically reduced and oil exports still banned, US oil prices might be influenced more by the global market for refined products, with its different dynamics and players, than by the global crude oil market .

In some respects, that sounds a lot like what many politicians and "energy hawks" have been seeking for years: a US no longer subject to foreign oil producers' price demands.  Yet this same scenario could yield all sorts of unintended consequences, including a less competitive US refining industry and higher or at least more volatile prices for gasoline, diesel and jet fuel.  And just as we've seen with cheap natural gas, cheaper oil could undermine the economics of the unconventional oil and gas production that makes it possible in the first place. 

US oil export policy merits a thorough reevaluation, and soon, because the regional impacts of a continued no-export stance could become pronounced, even if the US never reached overall oil self-sufficiency. Such a review should include related regulations, such as the Jones Act restrictions on shipping. With crude oil exports to Canada -- virtually the only allowed export destination for our newly abundant crude types--already rising rapidly, some Canadian refineries may be positioned to supply US east coast fuel markets more cheaply than refineries in New Jersey.  That certainly qualifies as an unintended consequence.

A slightly different version of this posting was previously published on the website of Pacific Energy Development Corporation.
Thursday, February 07, 2013

Comparing US Energy Growth in 2012

2012 was a remarkable year for energy in the US, with domestic output of oil, gas, wind and solar energy all advancing strongly.  This was the result of an unfolding revolution in unconventional oil and gas, along with federal, state and local incentives and regulations promoting renewable energy.  Yet despite extensive media coverage and vocal constituencies for each of these energy sources, I haven't seen any recent efforts to compare their respective contributions to US energy supplies. 

That may be due in part to the confusing array of energy units involved. It's daunting to match up oil in 42-gallon barrels (bbl), gas in cubic feet or British Thermal Units (BTUs), and wind and solar in kilowatts (kW) or Megawatts (MW) of capacity, or kilowatt-hours (kWh) or Megawatt-hours (MWh) of actual generation.  Conversion factors among these various units are easy to find on the internet.  However,  meaningful equivalencies are complicated by important distinctions between liquid or gaseous fuels and grid electricity, and the fact that these energy sources compete with each other only in specific situations.
For purposes of comparison, since wind and solar routinely compete with gas-fired generation, let's assume that the output of wind turbines and solar panels can be equated to the power from a natural gas turbine with an effective heat rate of 7,000 BTU/kWh.  That recognizes the efficiency losses in fossil generation and the premium value of electricity to end users.  Gas and gas-equivalent renewables can be further equated to oil using the standard conversion factor of 5.8 million BTU/bbl.  So even though wind and solar rarely compete with oil in the real world, because less than 0.6% of US electricity is now generated from petroleum products or byproducts, we can still assess their relative contributions to America's energy economy in familiar terms.  Please note that Energy Information Administration (EIA) data on production and generation for the full year won't be available until the end of the month, so the figures below are based on published data for the most recent available 12-month periods.
Through November oil production posted impressive gains last year , as noted several times in the presidential campaign and debates. Thanks to surging tight oil (shale oil) production in North Dakota, Texas and elsewhere, US crude oil output increased by 748,000 bbl/day on a December-November basis, or around 13%. In fact, November's production of 6.9 million bbl/day was the highest for any month since November 1993. Recent production looks even higher.
Natural gas also grew rapidly in 2012, with "marketed gas production", including gas liquids like ethane, propane and butane, growing by 1.4 trillion cubic feet for the 12 months ending in November 2012, compared to the same period a year earlier.  That's equivalent to adding at least 650,000 bbl/day of oil.  US gas production appears to have set an all-time record last October.
Wind power also had a banner year, with developers installing a record 13,124 MW of new capacity in the US.   Much of that growth was attributable to companies accelerating projects in anticipation of the scheduled December 31, 2012 expiration of the federal Production Tax Credit, or PTC, the main US tax incentive for wind energy. As it turned out, the Congress extended the PTC for another year as part of the recent "fiscal cliff" deal. On the basis of the most recent 12-month comparisons from the EIA, US wind farms generated 18 billion kWh more last year than the previous year.  That equates to 126 billion cubic feet (BCF) of natural gas, or around 59,000 bbl/day of oil.
That brings us to solar, which was on pace to set a record of around 3,200 MW of new installations in the US in 2012.  On a December-November basis new solar panels added roughly 2.5 billion kWh of reported generation last year, equivalent to 17 BCF of gas or 8,100 bbl/day of oil. This probably doesn't capture the contribution of all grid-independent installations, but it's unlikely to be off by more than a factor of 2.
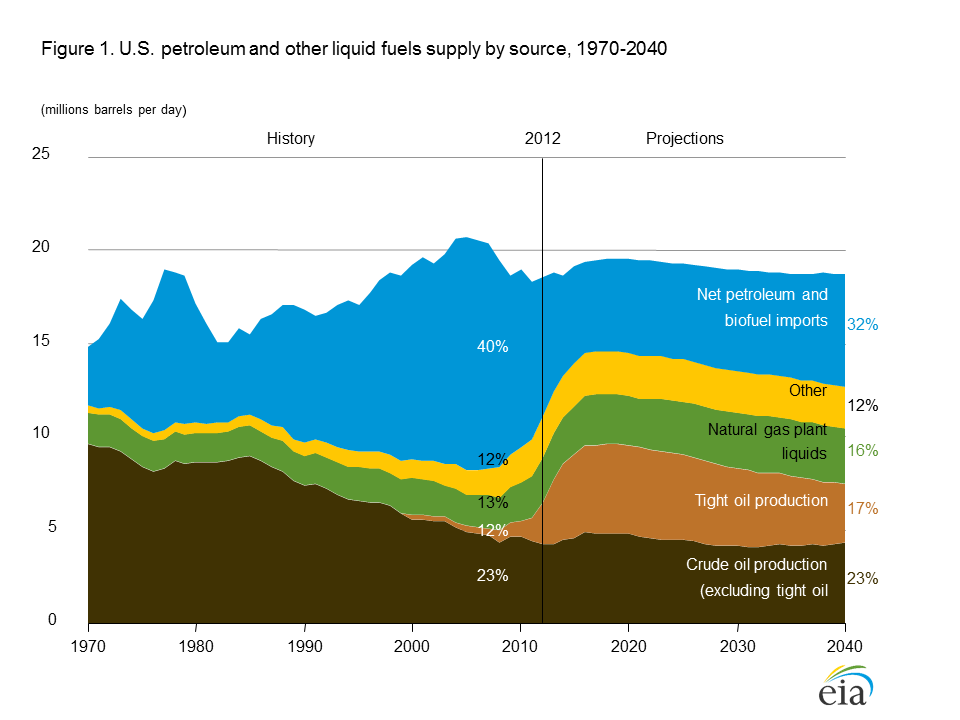
Although the above chart shows that wind and solar power have a long way to go to match the recent energy contributions of new fossil fuel production, both have earned credibility by advancing to the point of being measurable on the same scale as oil and gas.  Both also contribute to reducing emissions. At the same time, the significance of developments in US unconventional hydrocarbons leaps off the page.  In just the last year, for the second year in a row, shale gas has added domestic energy production roughly equivalent to the entire current output of all US non-hydro renewable electricity generation: wind, solar, geothermal, biomass and waste power. Tight oil added a like amount in 2012.  We're clearly in the midst of an energy transformation, but it doesn't much resemble the one that was anticipated just a few years ago.  
This is an updated version of a posting that was previously published on the website of Pacific Energy Development Corporation.
Thursday, October 04, 2012

Election 2012: Romney on Energy

After last week's review of President Obama's energy record and campaign materials on energy, Governor Romney's energy plans present a sharp contrast. They are based on a fundamentally different view of energy and the economy, relying on markets to allocate capital to the most productive opportunities, rather than on government to guide a mix of public and private investments along specific paths towards designated ends. They also emphasize technologies that are already deployed at scale today, not those still under development or striving to attain scale. Implicitly, the Romney plan prioritizes supplying the energy for a robust economic recovery over programs designed to address long-term environmental challenges like climate change. These positions present voters with a serious and consequential choice on November 6th.

The Romney campaign's website on energy arrays the candidate's ideas mainly in words, rather than with the kind of images and interactive features that dominate the Obama campaign's sites. Energy is the first plank of Governor Romney's five-point "Plan for a Stronger Middle Class", though it requires a little work to explore the details of his energy program. A list of bullet points  is backed up by a lengthy policy paper with numerous references to external sources, but you have to look for it.

The Romney energy plan focuses mainly on oil, gas, coal and nuclear energy, which together meet 91% of current US primary energy demand and which the Department of Energy projects will still provide nearly 90% in 2020 under the policies in place today. You won't find much on his campaign's website about the new renewables that generated electricity equivalent to 2% of our energy use last year, beyond a critique of the administration's investment in Solyndra and a commitment to R&D on new energy technologies.

Among the details of his plan are support for expanded offshore drilling, including areas such as offshore Virginia that were originally in the Obama administration's early-2010 offshore development blueprint, along with a comprehensive assessment of US resources using current technology, rather than further extrapolations based on 1980s technology. Governor Romney proposes expanding energy cooperation with both Canada and Mexico and would approve the entire Keystone XL pipeline. His goal of attaining North American energy independence is aggressive, yet recent analysis by Citigroup puts it within the realm of possibility. It appears to be based on an assessment by Wood Mackenzie, a top-notch energy consultancy, indicating that US oil and natural gas liquids output could expand by 7.6 million barrels per day, with 6.7 million of that coming from federal lands and waters currently off-limits to development. That compares to US net petroleum imports of 8.5 million barrels per day in 2011.

Another aspect of the plan aimed at streamlining the permitting of energy projects could be just as useful for utility-scale renewable energy projects as for oil and gas exploration and production. Regulatory and permitting delays are among the key reasons it takes longer and costs more to develop crucial energy and infrastructure projects here than in many of the countries against which our competitive standing has been slipping. Governor Romney also proposes giving states greater control of permitting on their non-park federal lands. That could substantially increase energy access and output, especially in the west, where the federal government owns over 280 hundred million acres, or 37% of those 11 states, net of tribal lands.

There are also some missing elements. I would have liked to see more about how renewables fit into Governor Romney's vision. He apparently supports the Renewable Fuels Standard but is silent about the increasingly urgent need to reform it. He is on record against the extension of the wind Production Tax Credit (PTC), a 20-year old subsidy roughly equivalent to the current price of natural gas, yet misses the opportunity to explain how all types of energy would be treated under his proposal to reduce corporate income tax rates while broadening the tax base--policy-speak for closing loopholes and eliminating incentives. In last night's debate he said, referring to the $2.8 billion in annual tax incentives for oil and gas identified by the Department of Energy, "... if we get that tax rate from 35 percent down to 25 percent, why that $2.8 billion is on the table. Of course it's on the table. That's probably not going to survive (if) you get that rate down to 25 percent." I'd also like to hear more about how Governor Romney would address greenhouse gas emissions once the economy returns to stronger growth.

Superficially, much of the Romney energy agenda evokes a return to the pre-2008 status quo: heavy on oil, gas and coal, light on renewables, and largely ignoring climate change. I see it from a different perspective: When Barack Obama began running for President in 2007, the US was considered by many to be tapped out on conventional energy, with domestic oil and natural gas production exhibiting signs of deep and permanent decline. In that context it made sense to look beyond those resources to the potential of renewable energy and vehicle electrification, even if the transition involved would be lengthy. That approach also appeared synergistic with reducing greenhouse gas emissions, and a strategy was born. In the meantime, however, it turned out that US oil and gas were far from exhausted, and the most productive new energy technology of this decade wasn't wind, solar or biofuels, but the combination of hydraulic fracturing ("fracking") and horizontal drilling that has unlocked hundreds of trillions of cubic feet of shale gas and tens of billions of barrels of shale oil or "tight oil" resources. Since 2008 the expansion of shale gas drilling has added as much new US energy production as over 250,000 MW of wind turbines or solar panels--8x the wind and solar power added in the same interval. To the surprise of many, the big global energy opportunity of the 20-teens is US hydrocarbons. The Romney plan reflects the unexpected energy transformation we're experiencing.

As in 2008, this blog isn't in the business of endorsing candidates. Energy remains an issue that, like the Cold War, demands bi-partisan cooperation and some level of consistency from one administration or Congress to the next. However, that doesn't prevent me from observing that the energy agendas of the two campaigns are not equally well-suited for a period of serious US fiscal constraints and shrinking federal discretionary expenditures, in which our energy security and economic growth will still depend largely on fossil fuels. In that context, it's highly relevant that the "all of the above" credentials of one candidate depend on oil and gas outcomes that his policies did little to support. Of course, energy isn't the only issue that matters, but then you wouldn't be reading this if you didn't think it was important.

Thursday, September 27, 2012

Candidates & Energy 2012: Obama

It's curious that energy hasn't been as big an issue in this year's presidential campaign as it was in 2008, the year of "Drill, baby, drill."  The price of unleaded regular gasoline has averaged roughly a dime per gallon higher through September than either last year or the same period in 2008, when prices peaked at $4.11 per gallon in July.  Gas prices are higher this year because global oil prices are also higher, with UK Brent crude averaging $15 per barrel over its 2008 full-year average, though without a similar spike.  One explanation for the reduced focus on energy is that President Obama co-opted his opponents' "all of the above" prescription, while indicators such as US crude oil production and natural gas output and prices have been moving in favorable directions.  The Obama campaign and key administration officials routinely draw a strong causal connection between those two facts, forming the basis of their campaign on energy.  But is that claim true?  Like the Washington Post fact checker's assessment of another frequent presidential assertion about energy, a finding of "true but false" seems appropriate.

Although I had intended to provide a side-by-side comparison of President Obama's and Governor Romney's energy agendas, it quickly became obvious that that was impractical, due to length and complexity.  I'll take a look at the challenger's ideas next week.  Since any re-election bid is fundamentally a referendum on the incumbent, it made sense to start with the record of an administration that came into office with an unusually clear and clearly articulated vision on energy, experienced some notable victories and defeats along the way, and ended up embracing a pair of big, emerging trends that it had done virtually nothing to foster. 

That is readily apparent when it comes to oil production, which must be a core element of any "all of the above" approach, since that "all" implicitly includes fossil fuels along with renewables and efficiency.  Go to the Obama campaign web page on energy and you'll see this chart:

It's a rescaled version of the chart below, which appears on the WhiteHouse.gov site on gas prices:


Aside from the fact that changing the axis scale makes the trend look much more dramatic, what's entirely missing from both these charts and the websites where they appear is any cogent explanation of why oil production is rising.  That requires some context about the industry and oil markets that I've overlaid in the following graphs:


Most oil projects big enough to matter aren't accomplished overnight. The process typically involves acquiring onshore or offshore leases, obtaining the necessary permits, conducting exploration activities that only proceed to the next step based on success, planning the required production wells and processing facilities, competing for internal funding against other company projects, obtaining additional permits, constructing facilities and drilling the production wells. Every step takes time.  Depending on the complexity of the project, the overall timeline can span from three to seven years, and that's if no one sues to block the project.  To see why oil production has been rising since 2009, we need to ask what was happening in 2003-6.  The answer is that after many years of being stuck in a range of $20-30 per barrel--with an excursion down to single digits in the late 1990s--oil prices tripled during that period, mainly due to the combination of global economic growth, especially in Asia, and the lagged effect on oil project investments from that late-'90s price crash.  In other words, production went up mainly because five or six years earlier the financial rewards for drilling suddenly got much bigger.

So at a minimum it's a stretch--mere spin--to claim credit for higher production that is attributable to events and perhaps policies on your predecessor's watch.  However, the picture looks worse when we factor in the policies and attitudes that went into effect when this administration took office in early 2009.  Recall that one of the first energy decisions of the new administration was Interior Secretary Salazar's cancellation of previously awarded oil leases in Utah.  Later that year a senior Treasury official--currently chairman of the President's Council of Economic Advisers--testified before Congress that US policies were promoting the "overproduction of US oil and gas", just as the now-touted production surge was starting.  For at least its first several years, the rhetoric and actions of the Obama White House were generally consistent with that view and with Mr. Obama's portrayal of oil and gas as "yesterday's energy" in his 2011 State of the Union address.  The brief offshore drilling opening signaled in spring 2010 was quickly retracted following the Deepwater Horizon accident, with the imposition of a six-month offshore drilling moratorium and subsequent "permitorium". Those responses--justified or not--resulted in Gulf of Mexico production falling by 22% since mid-2010, a decline that has been masked by the tremendous success of "tight oil" exploration and production in Texas and North Dakota. (The time lag for the moratorium's effects was negligible, because the deepwater projects that were halted had already been planned and permitted.)

In fact, the President's adoption of "all of the above" is fairly recent, making headlines following his 2012 State of the Union. It represents quite an evolution from Senator Obama's 2008 emphasis on renewable energy and climate change mitigation. President Obama certainly pursued those agendas with vigor, incorporating billions of dollars of federal grants and loan guarantees for renewables in the 2009 stimulus, backing the Waxman-Markey cap-and-trade bill, and at both the Copenhagen and Cancun UN climate conferences committing the US to significant greenhouse gas reduction targets and further negotiations. 

It hasn't all worked out as planned, though.  Notwithstanding the high-profile bankruptcies of Solyndra--a colossal failure of due diligence by the administration--and other loan guarantee and grant beneficiaries, the output of wind, solar and other non-hydro renewable energy generation has indeed grown by 55% since 2008, increasing from 3.1% to 4.7% of total US electricity generation, equivalent to 1.9% of total energy consumption.  Yet sadly the wind and solar manufacturing sectors that were to have produced so many "green jobs" are caught up in parallel waves of excess global production capacity that could take years--or wrenching consolidation--to work off.  The overcapacity that has blighted the prospects of many of these companies is largely attributable to the generous incentives provided by the US and other governments from Europe to Asia.  Direct wind and solar jobs accounted for just 54,000 of the US "clean economy jobs" tallied by Brookings and Battelle in their study last year, and they look no more secure than non-green jobs.

Climate policy is another area featuring a big disconnect between effort and results. With control of both Houses of Congress, the President backed a climate bill that exhibited all the worst tendencies of that body: 1,092 pages of bloated regulations and carve-outs for favored constituencies.  Even to someone who had supported the idea of cap and trade for a decade, it was a dog's breakfast, configured mainly as a production-inhibiting tax on the US petroleum sector.  Waxman-Markey failed to pass the Senate, and a more bi-partisan bill died in the aftermath of Deepwater Horizon and the recession. Whatever one's views on the science of climate change, costly climate legislation looked like a bad bet in a weak economy.  Actual emissions have fallen, however, as a result not of policy but of another trend that wasn't on the administration's radar screen until it grew too large to ignore: shale gas.  Emissions are at a 20-year low, mainly due to fuel switching from coal to cheap natural gas in the utility sector.

Another key trend cited as evidence of the effectiveness of the administration's energy policies is the reduction of oil imports that has occurred since 2008.  Yet like the facts on oil production, the causes are only tenuously connected to those policies.  From 2008-11, US net petroleum imports fell by 2.6 million bbl/day (MBD), including refined products.  That goes a long way toward achieving then-candidate Obama's goal of reducing imports by an amount equivalent to what the US imported from the Middle East and Venezuela.  However, the biggest contributor to this reduction was the 1.1 MBD increase in total US petroleum production (including natural gas liquids), followed by a 0.6 MBD drop in demand that had more to do with reduced driving and the weak economy than the early gains from tougher fuel economy rules. Increasing biofuel production associated with the 2007 Renewable Fuel Standard contributed another 0.3 MBD, although that policy now stands in urgent need of reform.

I have watched many elections in my life, and I can't honestly say I'm surprised to see an administration running on something other than its actual energy record, which in this case includes positives such as funding ARPA-E's potentially transformational energy R&D and having enough sense to keep largely out of the way of the shale gas revolution--at least for now. Yet having focused 90% of its efforts on a set of technologies that look important for the future but will still meet less than 10% of our energy needs for some time to come, they have now hitched their electoral wagon to an oil production surge that they didn't help and partly hindered.  I can only imagine that this would be deeply disappointing to those who supported Mr. Obama in 2008 because of his vision for alternative energy and the environment.  Nor does it provide much comfort to those who found large portions of that agenda ill-considered or premature. The President's 11th-hour conversion to "all of the above" creates great uncertainty about the course he would pursue with regard to energy for the next four years, if reelected.