Showing posts with label consumption. Show all posts

Thursday, February 13, 2014

US Oil Demand Returns to Growth

  • Early estimates indicate that US oil demand grew by 2% last year, after several years of declining consumption.
  • Although superficially consistent with recent GDP data, it's not yet clear whether this reflects a new trend or the results of non-recurring factors. 
After three straight years of declining oil consumption and a substantial net reduction since 2005, preliminary estimates suggest that US demand for petroleum and its products grew by 2% last year. In the estimation of the International Energy Agency (IEA) US demand growth in 2013 even outstripped that of China.  However, it strikes me as an exaggeration--or at least premature--to see signs, as a recent headline in the Financial Times suggested, that "America returns to gas-guzzling oil demand."  Is this a new trend, or just another blip?

The Energy Information Agency (EIA) of the US Department of Energy won't issue final figures on 2013 consumption for a few more weeks. In the interim, the American Petroleum Institute (API) released its estimates for December and the Fourth Quarter, showing a 5.8% year-on-year uptick for the month and a 4.6% increase for the quarter, compared to the final quarter of 2012. API's Chief Economist John Felmy cited "continued progress in domestic manufacturing as well as the broader economy."

The US economy has shown unexpected strength recently but continues to disappoint a sizable majority of Americans, based on recent polling. The economy added just under 200,000 jobs per month last year, while total employment remains  below its pre-recession peak. The government's first estimate at the end of January indicated that US gross domestic product grew by 3.2% in the fourth quarter of 2013, slower than the third quarter's relatively strong 4.1% pace. That puts full-year growth at 1.9%, or less than the 2.8% rate for the 2012 when US oil consumption shrank by 2% from the year before.

In any case, the  linkage between economic growth and oil demand has weakened over time, falling by more than 60% since the mid-1970s and by 20% just since 2000. In fact, following the peak in US oil demand in 2005, estimated oil and natural gas consumption per dollar of real GDP has declined by an average of 1.7% per year, only a little less than the average of post-recession US GDP growth. So annual efficiency gains come close to offsetting the impact of economic growth on US oil demand.

Some of this is the result of specific efficiency improvements, such as the 1.0 mile-per-gallon increase in the fuel economy of vehicles sold in 2013, compared to the previous year. Tracking data from the University of Michigan indicate a 16% improvement in the fuel economy of new cars since the 2008 model year. Of course it takes time for the impact of new higher-mpg vehicles to make a dent in the demand of a fleet of roughly 235 million cars and light trucks. That's even true of plug-in electric vehicles that use no liquid fuel at all. With cumulative US sales of around 160,000, EVs are displacing less than 5,000 barrels per day (bpd) of gasoline at this point, in a 9 million bpd market.

Because the primary use of oil in the US is in transportation, with less than 1% of it going to generate electricity, we should look at indicators of transportation activity for signals about changes in oil demand. The Federal Highway Administration's tally of US vehicle miles traveled (VMT) for 2013 was just 0.6% higher than 2012, through November, and remained more than 2% below its 2007 peak, only slightly more than a decade ago. If there's been a recent shift in driving habits, it's either well-hidden or involves a switch back to putting more miles on less-efficient vehicles--countering the anecdotal trend of the last few years. In the longer term, VMT growth will face headwinds from the changes in driver demographics I described last August.

In seeking explanations for last year's higher demand, we also can't ignore one-time factors like weather. Heating-degree-day data for the northeast during the fourth quarter shows a nearly 10% increase compared to 4Q2012. That indicates more days when the average temperature was farther below 65 F, and presumably more consumption of heating fuel as a result--a trend that seems to be continuing this quarter.

Scrutinizing EIA's detailed data on product supplied reveals that around two-thirds of the roughly 300,000 bpd annual increase in demand in 2013 (through October) was in the categories of liquefied petroleum gases (LPG) and low-sulfur distillate, both used for heating. For that matter, much of the growth in LPG demand is being met from the processing of shale gas, rather than crude oil refining, so its inclusion as part of "oil demand" is somewhat misleading. Nor do growing US net exports of refined products, at  around a million barrels per day last year according to API, have any bearing on this discussion, since they aren't included in the figures on which US consumption is gauged.

Another factor to consider when evaluating changes in oil demand is pricing. US retail gasoline prices averaged $0.11 per gallon less in 2013 than 2012, while retail diesel averaged around $0.05/gal. less. Those don't seem like big enough changes to affect demand, but the fourth quarter comparison is more dramatic, with gasoline and diesel $0.22 and $0.15/gal., respectively, less than a year earlier. That, together with a cooler fall, might help explain the fourth quarter bump in API's figures, which showed gasoline demand up by 3.7% year-on-year, and diesel up 5.3%.

Indications of a resurgence in US oil demand growth depend heavily on a single quarter's results, following a quarter of above-trend GDP growth--partially offset by efficiency gains that are expected to grow--and reinforced by cooler weather.  While I can easily imagine that a return to robust US economic growth, combined with persistently weaker fuel prices, could put US oil consumption on an ascending path again, I'd like to see a few more data points before discerning larger implications for global oil demand and prices.

A different version of this posting was previously published on the website of Pacific Energy Development Corporation.

Wednesday, August 28, 2013

Will Fewer Young Drivers Today Mean Lower Fuel Demand Tomorrow?

  • Driver's licenses for those under 40 years of age are down in several large, developed countries, including the US. This is only partially explained by a weak economy.
  • If this shift in attitudes towards driving persists, future demand for both cars and fuel could be permanently reduced.
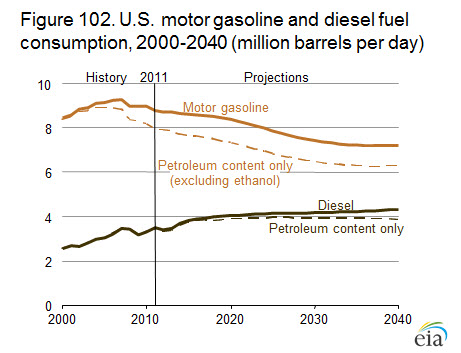
Current forecasts from the Energy Information Administration indicate that US gasoline demand peaked in 2007 and is expected to decline steadily for at least the next two decades.  One of the most intriguing factors aligned with this shift, which would have been almost unthinkable only a few years ago, involves a surprising reduction in the number of licensed drivers under 40 years of age.  A new study from the Transportation Research Institute (TRI) at the University of Michigan helps to explain a trend that is apparently not unique to the US.

Prior to the Great Recession, US gasoline demand had grown by 1-2% per year, with few interruptions. Since the recession, it has been shrinking for reasons that don't appear to be temporary. New cars are becoming more fuel-efficient, and Americans are consistently driving less than before the recession,  as indicated in the latest statistics on vehicle miles traveled.  To some extent this is an understandable response to gasoline prices that have remained significantly higher in real dollars than they were from 1982-2006. However, there may be other, deeper shifts underway.  If a segment of younger Americans has not only delayed getting a driver's license, but may never get one, then the decline in motor fuel demand is likelier to be permanent.

Once I started reading the survey results in the new study by the TRI's Brandon Schoettle and Dr. Michael Sivak, I knew I also needed the context of their 2011 paper on "Recent Changes in the Age Composition of Drivers in 15 Countries." That study showed that from 1983 to 2008 the number of licensed drivers in the US as a percentage of each age group up to 40 had dropped significantly, while the opposite was true for those over 50. (See chart below.) The authors found similar shifts in 7 other developed countries, including Canada, the UK, Germany and Japan, with a 2012 update indicating a further decline in US pre-40 licensing through 2010. Interestingly, Spain, Poland, Israel and several other countries exhibited increases in licensing among both younger and older drivers.
 
In their current paper, the authors used an online, non-random survey of 618 under-40 non-drivers to explore the reasons for their status. The top reasons their respondents gave for not having a driver's license seemed mainly practical, rather than philosophical. Many of those under 30 reported being "too busy or not enough time to get a driver's license",  or "able to get transportation from others." The "cost of owning and maintaining a vehicle" was the second-most common reason among all respondents, and as the authors noted, that is consistent with the relatively high unemployment or full-time student status of this group--46% and 21%, respectively.
 
Other common responses suggest that at least some of those without licenses are in that position by intention, rather than necessity. Nearly 40%--likely including some overlap--reported a preference for biking, walking or public transportation as a primary or secondary reason, while 9% cited environmental concerns and 8% mentioned online alternatives to driving.

Having grown up in a time and place where obtaining a driver's license as close as possible to one's 16th birthday was both a rite of passage and a practical necessity, this is that rare energy issue that's hard for me even to relate to. Yet when I look at the above chart, with its mirror-image shifts, I'm struck by the similarity between recent under-40 driver's license data and those for the cohorts born between the World Wars.  Are the current license rates of Millennials and late-Gen-X'ers the anomaly, or will those of my Baby Boomer and early Generation X peers turn out to be uniquely high? Only the passage of time can clarify such questions.

While the authors stopped short of assigning cause and effect, it seems reasonable to conclude that at least part of what we're seeing here is the result of the stubbornly persistent youth unemployment of a tepid recovery and the "New Normal" economy. A few years of much stronger economic growth might shrink the gap shown in Figure 1, by addressing the reasons that many of those surveyed gave for not having a driver's license, particularly since only 6% of them reported they never learned to drive.  Of course that doesn't explain why more than a third of those in the 30-39 age group, who ought to be the most financially settled, indicated they planned never to get a license.

The survey's results and their implications ought to be of great interest to producers of conventional and alternative fuels, established auto manufacturers, car rental firms, as well as transportation planners and policy makers.  Even electric-vehicle startups like Tesla might wonder whether for a significant segment of their natural future market, the choice won't be between an EV and a conventional car, but between a car and not driving at all. This is a trend that bears watching.
 
A different version of this posting was previously published on the website of Pacific Energy Development Corporation.

Thursday, February 18, 2010

The Challenge of Scale

This morning's Wall St. Journal featured a front-page article on small-scale nuclear power, highlighting how reactors a tenth the size of current commercial designs could significantly reduce the financial risks associated with these mega-projects. This is one example of the need to think in new ways about scale when addressing our energy challenges. In his talk at this year's TED conference in Long Beach, Bill Gates offered another surprising perspective on scale: "All the batteries we make now could store less than 10 minutes of all the energy [in the world]," he said. Framed between those two examples is the basic proposition that while solving our energy problems may require breaking them down into more manageable pieces, they must still add up to mind-numbingly stupendous sums.

According to figures from the Energy Information Agency of the Department of Energy, in 2008 the US consumed 99.3 quads of primary energy--oil, gas, coal, nuclear power, hydropower, biomass and other renewables--down from 101.6 quads the year before. A quad is one quadrillion times the quantity of energy required to raise the temperature of a pound of water by one degree Fahrenheit, where a quadrillion is 1 followed by 15 zeroes (US definition.) Can you picture that? I can't. If I convert that consumption to barrels of oil equivalent at the rate of 5.8 million BTUs each, we get a value of just over 17 billion barrels--a much more familiar unit, especially when we divide by 365 to get 47 million barrels per day. Millions are much closer to something we can grasp, and if we are familiar with energy data we know that's equivalent to a little more than half the amount of oil produced globally every day. It's still hard to picture, though, until you work out that if it were all put in one place in outer space, it would form a spherical blob roughly 800 ft. in diameter--over half as tall as the Empire State Building--and that's every day.

By comparison the daily output of a 3 MW wind turbine, converted to its energy-equivalent of oil (assuming it backs out natural gas from a gas turbine power plant) would form a ball about 7 ft. across. It would take 1,400,000 such balls to fill the big sphere. Of course we can't really compare the output of 1.4 million wind turbines to the total amount of energy we use each day, for many reasons, though it's a handy reminder of just how big the challenge is, and why building nuclear reactors in increments of 125 MW each might be a smart way to finesse this gap.

A 125 MW reactor, if it operated with the same reliability that large nuclear plants have achieved, would produce as much power every day as 125 of those 3 MW wind turbines. And while we doubtless couldn't build these reactors as fast as wind turbines, I'll bet we could add nuclear power capacity faster in these increments than with 1,200-1,500 MW reactors, because of the advantages of being able to manufacture more of each facility in a factory, rather than constructing them on-site. Even if that translated into total project timelines only half as long as for large-scale nuclear plants of the kind for which the administration just awarded federal loan guarantees, that could be worth a lot to the utilities and merchant generating companies building them. It would greatly reduce project risks of the kind that can ruin the economics of big investments--delays, cost over-runs, accidents--and that give companies' bankers and shareholder chills. These aren't the kind of risks the government is offering to defray, by the way.

Of course that doesn't make small nuclear an either/or proposition vs. large-scale nuclear, any more than wind and solar are an either/or proposition vs. oil & gas platforms or big gas-fired power plants that can operate efficiently 24/7. There's room--and need--in our national energy economy for all of these, as our energy diet shifts from a heavy reliance on fossil fuels to a lighter, more sustainable diet in the future. At the same time, it's clear that we can't fill the gap exclusively with small-scale energy sources, without a sizable contribution from sources at least as big as these small reactors. "Drill, baby, drill" only captured one aspect of this concern. More accurately, our energy policy must deliver "scale, baby, scale."

Tuesday, August 19, 2008

The Persistence of Change

Weakening demand appears to be the main oil market driver these days, with the US having just tallied its 12th consecutive monthly decline in gasoline demand, year-on-year. For the moment, at least, good old supply and demand have displaced imminent Peak Oil and a perceived commodity bubble as the dominant narrative. If we needed further evidence of that, the market's collective yawn at Russia's threat to the Caspian pipelines passing through Georgia ought to serve nicely. But how much of the recent decline in consumption is attributable to the price elasticity of demand, and how much to the weakening US economy? The answer is of more than passing interest, signifying whether we're likely to see a bounce in demand once the pump price catches up with the 20% decline in the price of West Texas Intermediate crude oil since the 4th of July.

The US average retail gasoline price has fallen for six weeks and currently stands at $3.74 per gallon. Barring an unexpected oil-price rally or a major refining problem, unleaded regular prices beginning with a "4" should soon disappear at all but the most expensive stations, even in California. Perhaps this is just a case of the August doldrums, but the price of oil is currently stuck in a range that defies the principal explanations for its behavior earlier this year. With the market clearly responding to fundamentals, its path from here will depend heavily on whether consumers continue to drive less, and that depends on the relative importance of the psychological impact of $4 gasoline, compared to a broad range of economic factors including falling home prices, tightening credit and surging inflation--some of which is attributable to high fuel prices.

The last stretch in which US gasoline demand declined for 12 consecutive months occurred in 1990-91, a period that also coincided with a spike in fuel prices--thanks to Saddam Hussein--and a recession. The Gulf Coast hurricanes of 2005, which gave the country its first taste of $3 gasoline, caused only a brief drop in demand. Within 3 months of Katrina's landfall monthly US gasoline demand had resumed its year-on-year growth, consistent with the robust economic growth (helped by the housing bubble) that we were experiencing at the time. Nor did the recession of 2000-2001 prevent gasoline demand from growing by 1.6%, with only a few months exhibiting declines versus the same month of the previous year. Of course, gasoline was well under $2 at the time.

It seems to require an unusual combination of low growth and high prices to overcome the inherent gasoline demand trend of the US economy and shock consumers into conservation mode. Since the economy seems unlikely to recover soon, the persistence of the recent changes in consumer behavior concerning fuel consumption and new car selection thus hinges on just how cheap $3.50 gas will seem to America's drivers after a couple of months over $4.00 per gallon. In the absence of more dramatic events, this could also determine the price of oil on Election Day, a parameter that could influence that contest's outcome.

Thursday, April 24, 2008

Unambitious Targets

In the last week or so, the administration has come out with two energy-related plans that merit a few comments here. President Bush's proposal to halt the growth of US greenhouse gas emissions by 2025 has generally been greeted as too little, too late, particularly overseas. With the Intergovernmental Panel on Climate Change having called in their latest report for significant global cuts in emissions by mid-century, a freeze within 20 years seems a slow start, at best, particularly since Mr. Bush's approach would concentrate on a few sectors, rather than the entire economy. But has anyone noticed that US emissions have already ceased growing? Similarly, the implementation plans for the higher Corporate Average Fuel Economy standard that came out of the 2007 Energy Bill, and which the Secretary of Transportation called "historically ambitious" look less so, when compared to the fuel economy of the current new car fleet.

US emissions of the greenhouse gases (GHGs) implicated in climate change have grown significantly over the last couple of decades. Compared to the Kyoto Protocol's baseline year of 1990, we now emit 14% more. Yet from 2001 to 2006, net US emissions--sources minus sinks--have been essentially flat. Slight rises in 2004 and 2005 were offset by a drop in 2006, leaving us with a net of 6.17 billion metric tons per year of CO2-equivalent emissions. That's still too much, but it's a far cry from the projections of a 35% increase over 1990 levels that I used to see when I tracked this issue for Texaco. And while the EPA hasn't reported 2007 data yet, it's hard to imagine that they would reflect much of a jump, given the increases in energy prices we saw last year. So if US emissions have already stalled, and high energy prices appear likely to keep a lid on them for at least the next year or two, then the prospect of beginning to reduce them seems much more realistic than if they were still growing by 1-2% per year. What could we accomplish by 2025, from our actual starting point of a five-year plateau? I'm not sure, but that seems like a better question to be asking, than how to keep them flat for another 17 years.

Turning to CAFE, the proposed timetable for implementing the 35 mpg standard that was signed into law last December would raise the overall fuel economy of the new car fleet, including SUVs, to 27.8 mpg by the 2011 model year and to 31.6 mpg by 2015. In particular, the average for new passenger cars would have to rise from the current 27.5 mpg annual target to 31.2 mpg by 2011 and to 35.7 by 2015. That sounds quite aggressive, until you realize that the data from the National Highway Traffic Safety Administration, under whose authority the CAFE program falls, show that the 2007 model average passenger car fleet already gets 31.3 mpg. For that matter, based on the sales mix reflected in NHSTA's January 2008 CAFE report, the combined 2007 new car fleet delivered an average of 27.2 mpg. With SUV sales having fallen back below 50% from their 2004 high of 53%, it's a reasonable bet that the shifting sales mix alone would allow the fleet to achieve the 2011 goal without any changes in vehicle performance. In that context, the 2015 milestone goal of 31.6 mpg overall looks more like a 2% per year average improvement over the next seven model years, rather than the 4.5% cited by Secretary Peters.

The conservatism embodied in the new CAFE timeline is at least more understandable than that for GHGs. Designing more efficient car models won't be accomplished overnight, and then factories must be retooled to build them. A standard that pushed too hard at the front end would merely result in larger fines for manufacturers, or a bigger shift to imports. What is less understandable is the hoopla the timeline has generated. Perhaps this is aimed at shaping the expectations of consumers. After all, unless they alter their buying habits to prefer higher fuel economy to ever-higher horsepower, CAFE will merely be an accounting system with a relatively weak enforcement mechanism, rather than a serious means of reducing the annual fuel consumption of America's 240 million automobiles.

Tuesday, March 04, 2008

A Stall Point for Oil?

It's been a long time since the oil markets offered much good news, particularly on the supply side. Since the end of 2002, a litany of strikes, war, social unrest, sanctions, and other factors have contributed to oil's volatile climb from the mid-$20s to yesterday's settlement at $102.45 per barrel. Now we are treated to the possibility of armed conflict between three South American nations that between them account for about 5% of global oil production and exports. With demand in Asia compounding these pressures, it's ironic that the best news the market might get for a while should come in the form of consumption data for the world's largest oil importer, reflecting the price elasticity of demand and the impact of higher biofuels output.

The Energy Information Agency's figures for petroleum supply and demand in December 2007 are coming in, now, and the resulting annual totals represent milestones in several categories. Importantly, they show that as a result of the combination of higher oil and refined product prices and a slowing economy, and after factoring in the contribution of biofuels under the previous Renewable Fuel Standard, the growth of US oil consumption seems to have reached a stall point. And while in the past I might have been tempted to add, "for now," it isn't easy to envision the circumstances under which that growth would return to previous levels, even in a recovering economy.

With the addition of December's 9.25 million barrels per day (bpd) of finished gasoline supplied to the US market, our 2007 average consumption of 9.29 million bpd was only 0.4% higher than 2006. And when the larger quantity of ethanol blended into gasoline last year is factored in, the quantity of petroleum-based gasoline supplied actually declined by about 0.6%. In addition, total crude oil and petroleum product consumption in 2007 was essentially unchanged versus 2006, at 20.7 million bpd, before factoring in the 96,000 bpd year-on-year increase in ethanol use. Our net imports of crude oil and petroleum products were down, as well.

With our total oil demand essentially flat for four years, the US may have reached its petroleum high-water mark, from which consumption will gradually decline. Even if the benefit of more efficient vehicles is partially offset by a growing population and continued increases in annual miles driven, alternative fuels have finally reached a scale at which they are beginning to erode oil's market share in transportation, where it has been unchallenged for a century. Of course, halting US oil demand growth doesn't eliminate our 12 million bpd of net crude oil and refined product imports.

Skeptics would be right to remind us that we've been here before, and it didn't last. Between 1978 and 1983, total US oil consumption fell by almost 20%, before resuming its steady growth and breaking the old record in 1998. However, much has changed since then. Better technology and the urgency of addressing climate change have altered the energy landscape so much that it's even possible to extrapolate from static US oil demand to a future peak in global oil demand, a twist on the notion of Peak Oil that has nothing to do with the ongoing debate about how many barrels we can coax out of the earth. Reaching that point will require much hard work, including ensuring that when our economy recovers from its current woes, it is more energy efficient and makes better use of all the domestic energy sources at our disposal.

Thursday, January 17, 2008

Raising Fuel Taxes

At the same time that I was writing about the demand response to higher fuel prices on Tuesday, a Congressionally-appointed commission was meeting in Washington to propose an increase in the gasoline tax that would raise those prices further, in order to maintain the nation's highways. Last summer's bridge collapse in Minneapolis delivered a warning about the condition of America's road infrastructure. Without an increase in the federal highway budget, and in the 18.4 cent per gallon federal gasoline tax that funds it, the situation will get worse. This proposal will test our attitude towards a tax that has long been regarded as untouchable. It will also have implications for the US response to climate change.

Every year that goes by without an increase in the road tax, the purchasing power of the revenue it generates shrinks. If the new 35 mpg CAFE standard succeeds in reducing fuel consumption, then that tax revenue will begin to decline in nominal terms, as well. The recommendation of the National Surface Transportation Policy and Revenue Study Commission for a series of annual 5 cent-per-gallon tax increases suggests that we will be in catch-up mode for some time. But without diminishing the important safety concerns underlying the commission's work, the road tax is the tip of the iceberg. The necessity of reducing greenhouse gas emissions from the transportation sector makes it likely that some form of additional fuel taxation, either directly, in the form of a carbon tax, or indirectly, through a cap-and-trade system, will be a key component of national climate change policy within a few years.

As a new study from the Congressional Budget Office confirms, higher fuel prices stimulate changes in driving behavior and habits, along with consumer preferences for more efficient cars. Considering the amount by which we must reduce emissions over the next several decades, and the changes in consumption necessary to achieve those reductions, this will take a lot more than an extra 5 or 10 cents per gallon, on top of what is required to bring the highway trust fund back into the black. If the cost of CO2 credits under a greenhouse gas cap-and-trade plan reaches $20 or $30/ton, then in fairly short order consumers would see gasoline prices rise by 20 or 30 cents per gallon, dictated by the simple chemistry of hydrocarbon combustion and the increase in producers' costs. Depending on the severity of cuts desired, $100/ton--or $1.00/gallon--is possible.

None of this will be easy. Even without predictable opposition from groups that object to higher taxes of any stripe--a position to which I'm normally sympathetic--it will not be popular to tell Americans who have already seen retail gasoline prices double in the last four years and triple in the last ten that they still aren't paying enough. The burden will fall disproportionately on lower-income folks, and that will complicate both the politics and implementation. Throw in a looming recession, and the obstacles become formidable. Nevertheless, if we want to keep our roads and bridges in good repair, improve our energy security, and reduce greenhouse gas emissions, higher motor fuel taxes now seem unavoidable.

Thursday, January 10, 2008

The Context of Efficiency

Here's a nice example of the vital distinction between consumption and efficiency. If I told you that a company was about to introduce a new car model that was expected to average 56 miles per gallon, and that it was going to be so cheap that nearly anyone could afford one, that would sound like great news, wouldn't it? Perhaps it depends on the context in which that car is introduced, and our assumptions about what it will displace. The car in question is Tata Motors' eagerly-awaited "1-Lakh" car--referring to its 100,000 Rupees price equating to $2546 at yesterday's exchange rate--and the target market is millions of Indians who haven't been able to afford a car yet. Even at an expected efficiency of 56 mpg, though, the Nano, to give its proper name, will create incremental consumption of petroleum products and new greenhouse gases emissions.

At an initial 60,000 units per year, the Nano will hardly alter the global oil supply and demand balance overnight. If driven 5000 miles each, the entire first year's production would consume only 350 barrels per day of fuel, or about as much as 11,000 average American cars. Of course, we're talking about a potential market of tens of millions of such cars, and as today's Wall Street Journal reminds us, there are a number of carmakers and models competing for that market. Selling 50 million such cars here would increase our fleet average efficiency to 32 mpg and save over 800,000 barrels per day of gasoline and 120 million tons per year of CO2. Selling 50 million of them in India, however, could increase consumption by 300,000 barrels per day, while adding 42 million tons per year of CO2.

While efficiency is probably the single most powerful tool available to us in trying to bring global energy use and emissions under control, it doesn't tell the whole story. Consumption is what counts, and at least in the case of Tata's new model, every new car out the door adds to consumption, no matter how many miles per liter it gets, because at the entry level it's displacing bicycles, mass transit, and walking. That isn't the case in the US, where the market is mature and most new cars replace older cars. Here the fuel economy indicated on a new car's sticker is only one variable that will determine its ultimate consumption, along with the city/highway driving mix, total miles driven, and the owner's driving style and maintenance habits.

You might also expect a car powered by a 32-HP engine and weighing 40% less than Toyota's smallest US offering, the 36 mpg Yaris, to do even better than 56 mpg. Unfortunately, $2,500 won't buy much in the way of sophisticated engine efficiency upgrades, let alone pay for the kind of hybrid approach used in the Prius. In this light, the 100 mpg initial target that the MIT-led Vehicle Design Summit is working toward for an entry-level car for India looks pretty ambitious.

Value judgments about this sort of thing are complex. At the same time we recognize that the expansion of personal mobility in developing countries complicates the energy and environmental challenges we all face, we might also experience a vicarious thrill at the benefits it should bring, provided that Indians don't feel obligated to repeat every mistake we've made in the one hundred years (this October) since the first of 15 million Model Ts rolled off Mr. Ford's assembly line. Sharing the lessons we've learned about transportation may be every bit as important as the technology sharing that was a major theme at the Bali climate change conference last month.